Free Access
Fig. B.1.
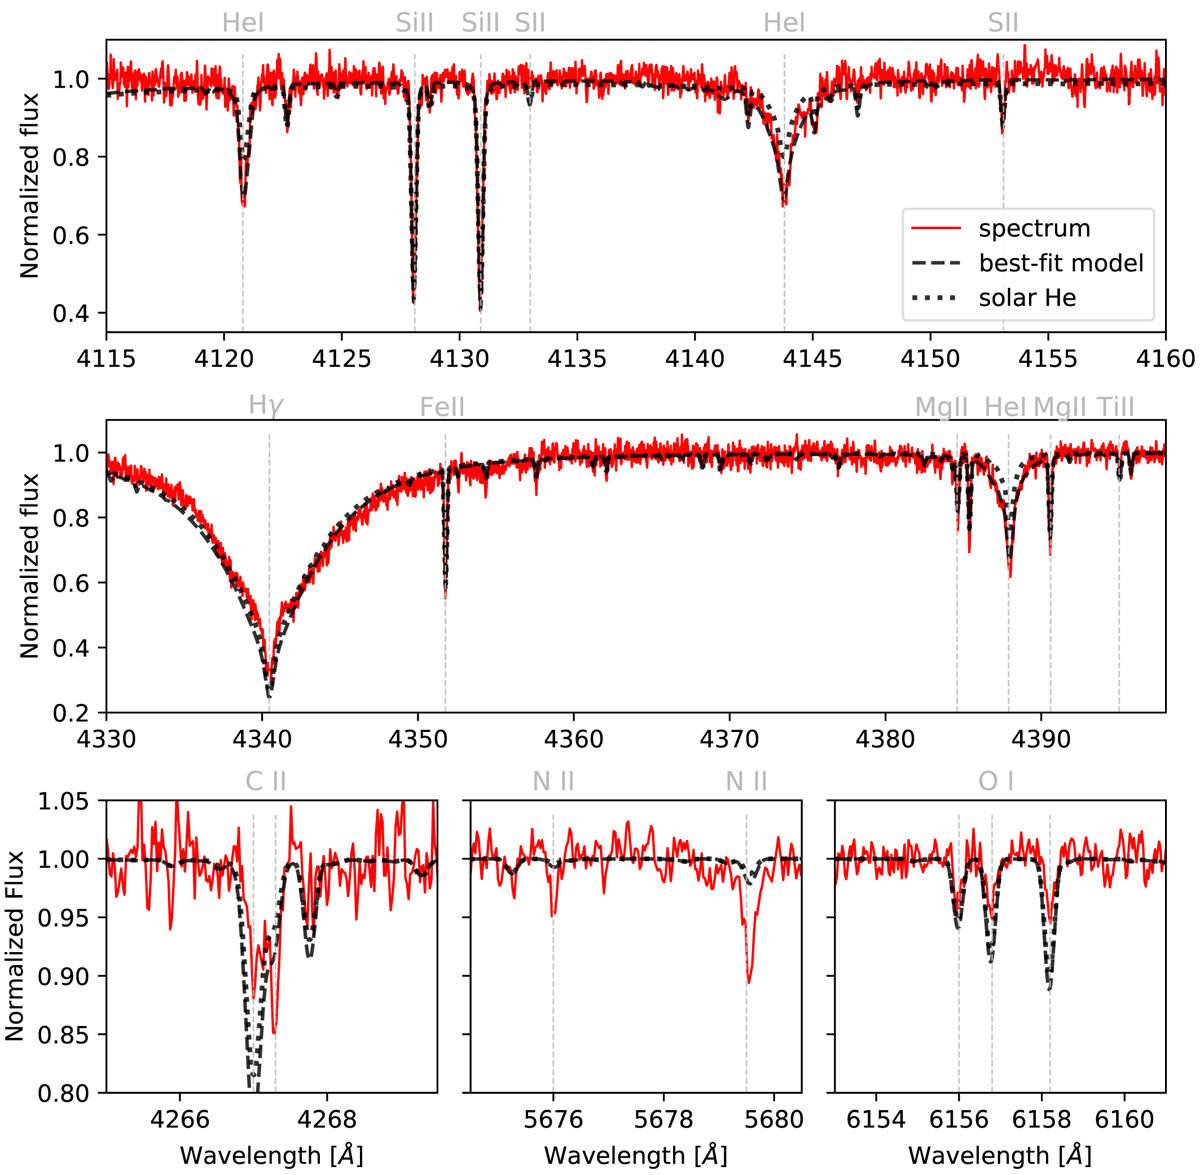
Comparison between the disentangled spectrum of the primary with the best-fit GSSP model and a model of identical parameters but a solar He abundance (see legend). The three bottom panels focus on C, N, and O lines. The main spectral lines are indicated.
Current usage metrics show cumulative count of Article Views (full-text article views including HTML views, PDF and ePub downloads, according to the available data) and Abstracts Views on Vision4Press platform.
Data correspond to usage on the plateform after 2015. The current usage metrics is available 48-96 hours after online publication and is updated daily on week days.
Initial download of the metrics may take a while.