Fig. 3
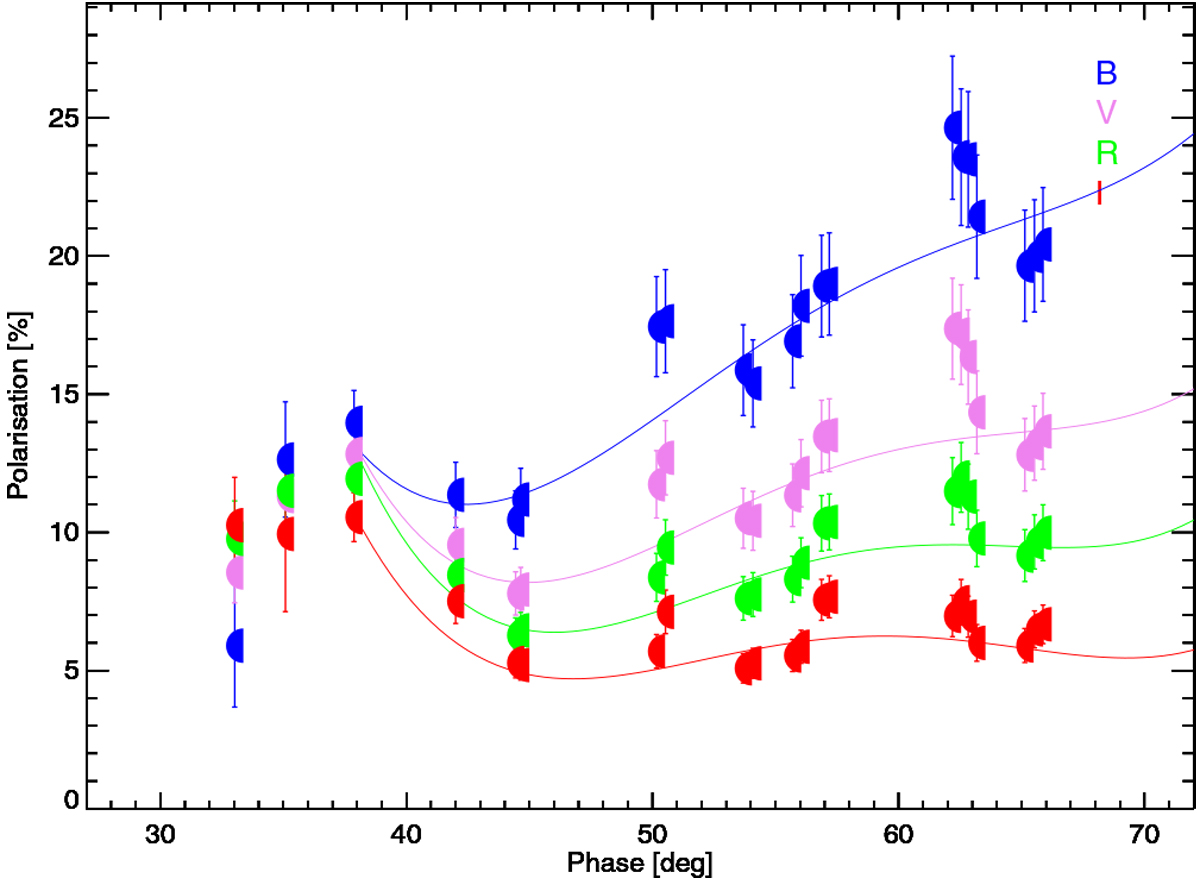
Fractional polarisation of Earth PE after correction for lunar depolarisation effects as a function of the phase angle (Sun–Earth–Moon). Colours indicate the values for different bandpasses B, V, R, and I. The lines fit a low-order polynomial to the data in each band, and help to guide the eye to follow the general trends of the phase curves between 35° and 70°.
Current usage metrics show cumulative count of Article Views (full-text article views including HTML views, PDF and ePub downloads, according to the available data) and Abstracts Views on Vision4Press platform.
Data correspond to usage on the plateform after 2015. The current usage metrics is available 48-96 hours after online publication and is updated daily on week days.
Initial download of the metrics may take a while.