Fig. 6.
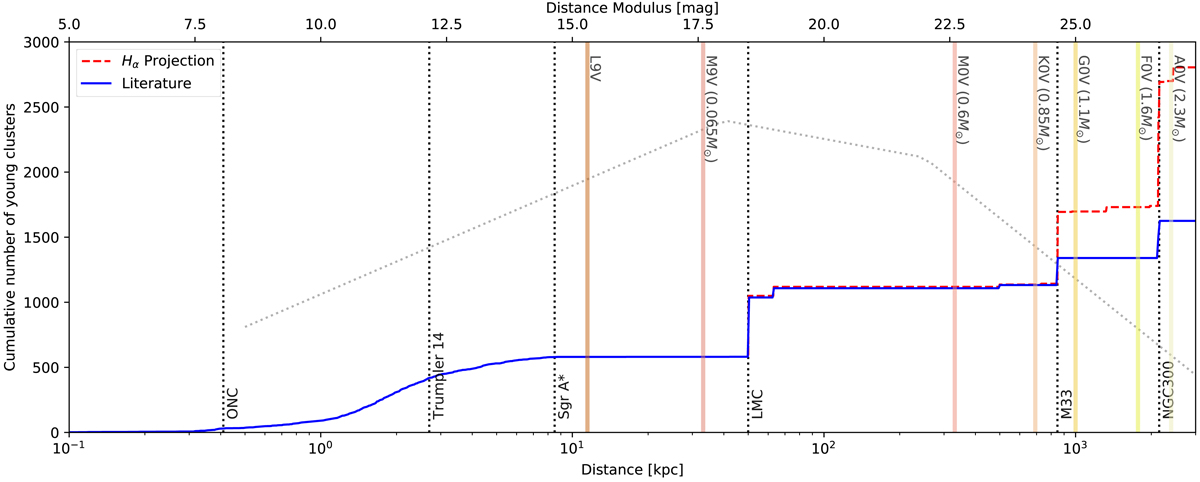
Cumulative number of young cluster targets that will be available to MICADO (δ < +35°) out to 2 Mpc. The blue line shows the cumulative number of young clusters with increasing distance from Earth as reported in catalogues and the literature (see references in Table A.2). The red dotted line shows the expected number of young clusters in a given galaxy based on an extrapolation of a galaxy’s star formation rate from its total Hα flux (Caldwell et al. 2009). The solid vertical lines represent the observational horizons for given stellar spectral types assuming a detection limit of K = 28m with MICADO at the ELT. The faint dotted grey line represents the regions of the IMF that are available to study with MICADO at different distances. The population of Milky Way clusters is taken from the HEASARC Milky Way Open Cluster database (Kharchenko et al. 2013) and represents only the clusters located at declinations accessible to the ELT (−85° < δ < +35°).
Current usage metrics show cumulative count of Article Views (full-text article views including HTML views, PDF and ePub downloads, according to the available data) and Abstracts Views on Vision4Press platform.
Data correspond to usage on the plateform after 2015. The current usage metrics is available 48-96 hours after online publication and is updated daily on week days.
Initial download of the metrics may take a while.