Fig. 5.
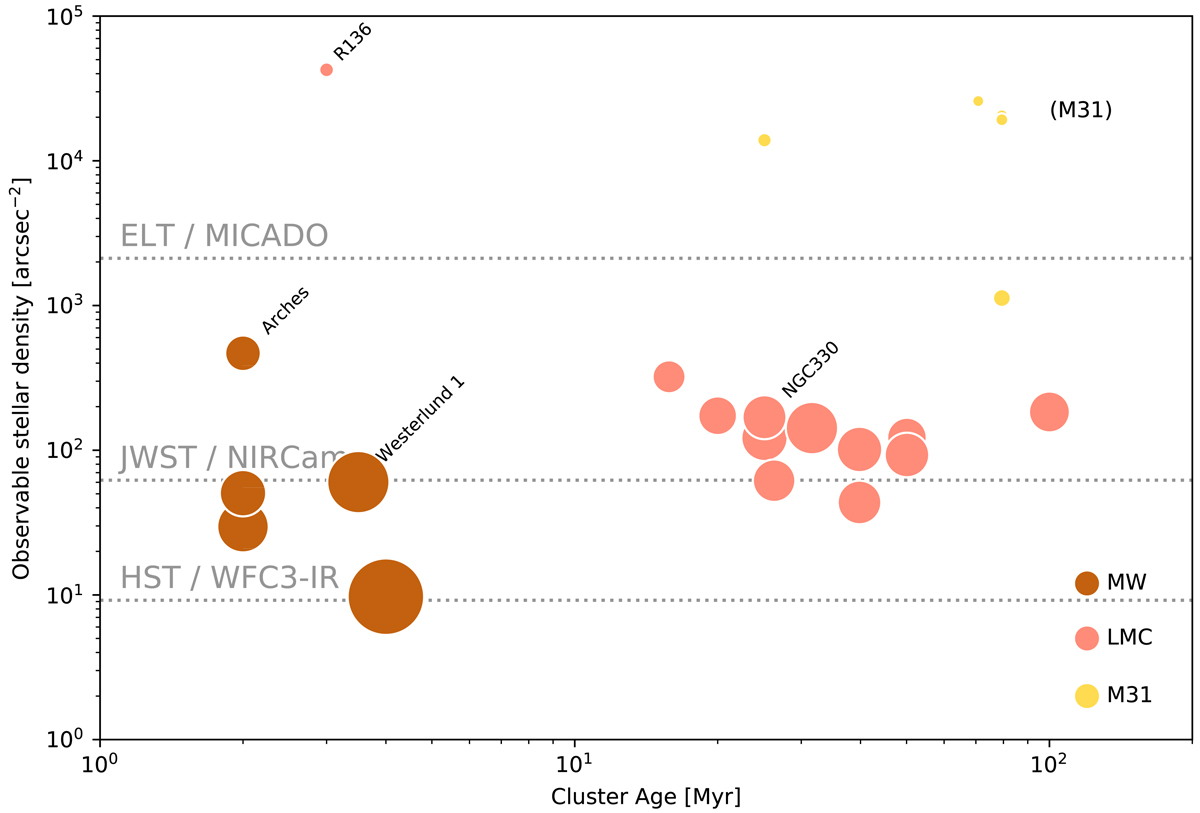
Stellar densities in the cores of the YMCs listed in Table A.1, assuming a sensitivity limit of KS = 28m. While these clusters are spread across the whole sky, only the handful of YMCs in M 31 are outside the observing window of the ELT. The sizes of the circles roughly illustrate the relative on-sky sizes of the cluster cores. The colours reflect the minimum observable mass, as shown in Fig. 4 and listed in Table A.1. Brown represents M > 0.01 M⊙, pink is for M > 0.1 M⊙, and yellow shows M > 0.9 M⊙. The densities shown here take the sensitivity limit into account and are therefore only for observable stars in each cluster, i.e, stars with KS > 28m are omitted from the density calculation. This means that all stars in the Milky Way, M-type stars and brighter in the LMC, and G-type stars and brighter in M 31, are included. The dashed lines in this figure represent the (estimated) limit to the resolving capability of the HST, JWST, and ELT. We define the limiting density as the density where the mean distance between stars is equal to twice the H-band PSF FWHM. Cluster cores of the majority of young clusters outside the Milky Way are far too dense for either HST or JWST observations.
Current usage metrics show cumulative count of Article Views (full-text article views including HTML views, PDF and ePub downloads, according to the available data) and Abstracts Views on Vision4Press platform.
Data correspond to usage on the plateform after 2015. The current usage metrics is available 48-96 hours after online publication and is updated daily on week days.
Initial download of the metrics may take a while.