Fig. 4.
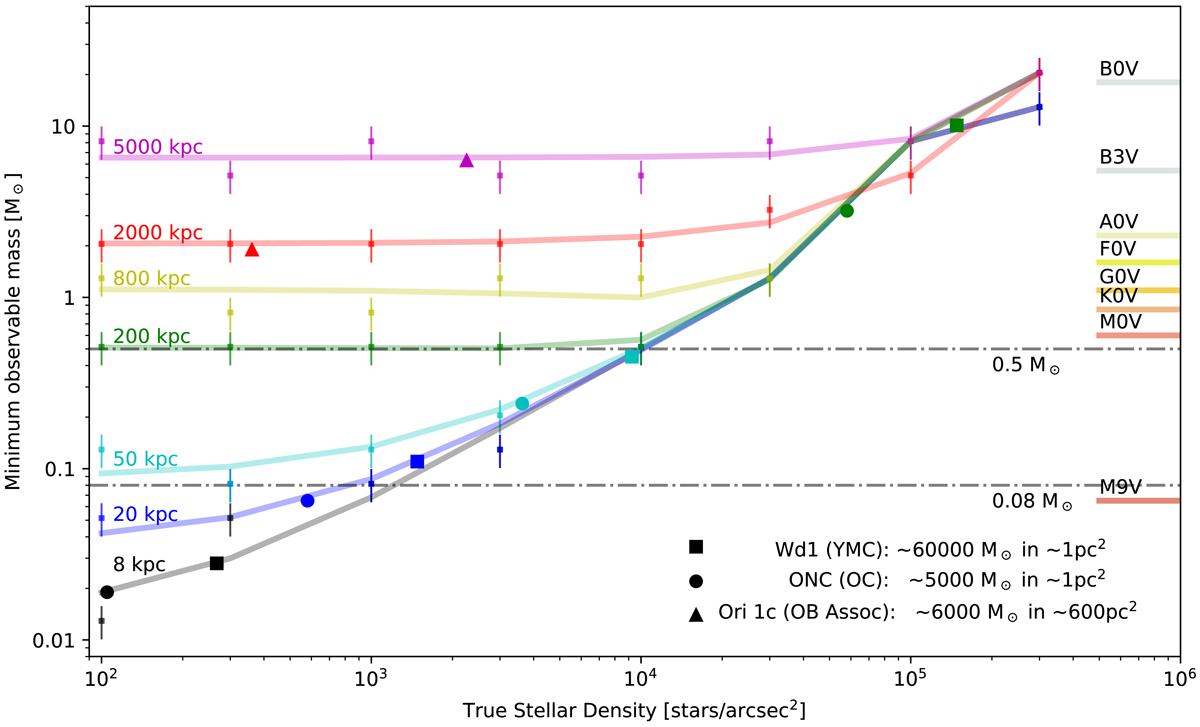
Lowest observable masses for given stellar densities and distances. The errors in the observable mass are 0.2 dex and correspond to the size of the mass bins. Two trends are visible in the best-fit lines for each distance: a flat regime where the limiting mass is constrained by the sensitivity limit of MICADO, and an exponential regime where crowding becomes the limiting factor. The void to the lower right shows the parameter space in which stars of a given mass will not be observable for a given stellar density.
Current usage metrics show cumulative count of Article Views (full-text article views including HTML views, PDF and ePub downloads, according to the available data) and Abstracts Views on Vision4Press platform.
Data correspond to usage on the plateform after 2015. The current usage metrics is available 48-96 hours after online publication and is updated daily on week days.
Initial download of the metrics may take a while.