Fig. 2.
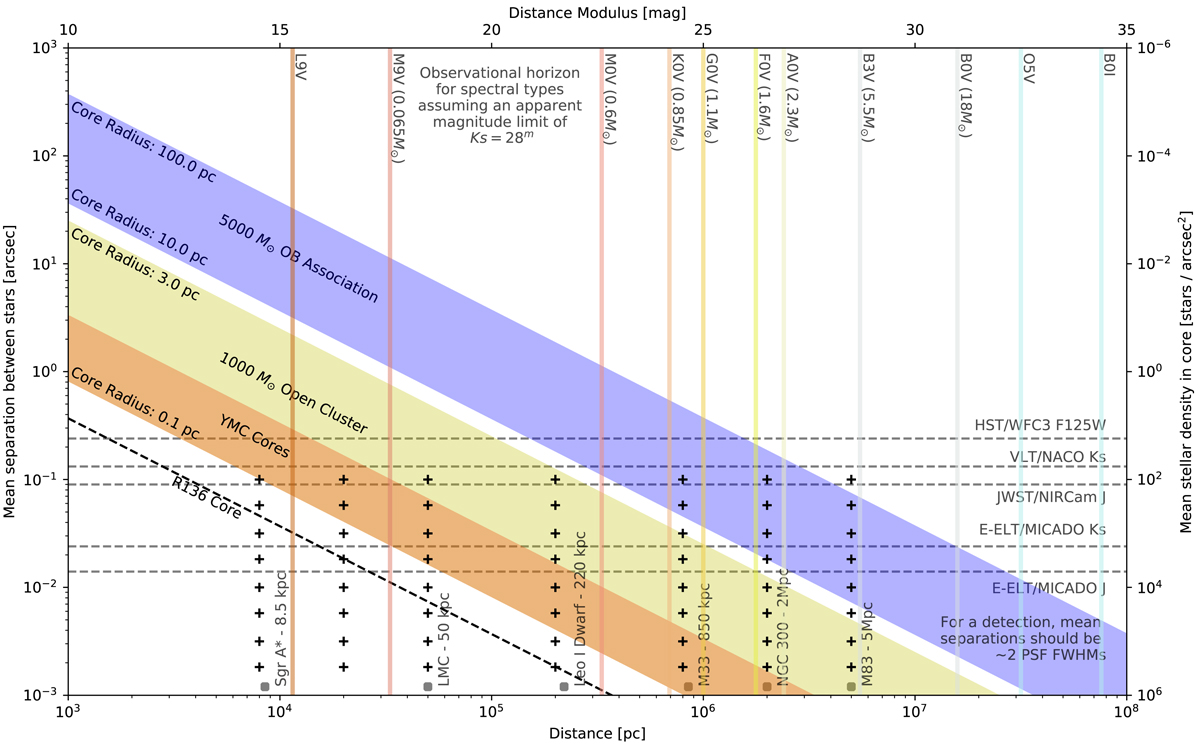
Stellar density parameter space covered by the dense stellar fields in this study (crosses). The diagonal bands represent the range of core densities for the three main categories of young stellar populations: YMCs (orange), open clusters (green), and OB associations (blue). The vertical lines represent the farthest distance at which a particular type of main-sequence star will still be above the detection limit of MICADO, i.e., Ks = 28m. The dashed horizontal lines show the theoretical confusion limit for MICADO/ELT, JWST, HST, and an instrument similar to NACO/VLT. The confusion limit assumes an average minimum distance of twice the PSF FWHM between stars.
Current usage metrics show cumulative count of Article Views (full-text article views including HTML views, PDF and ePub downloads, according to the available data) and Abstracts Views on Vision4Press platform.
Data correspond to usage on the plateform after 2015. The current usage metrics is available 48-96 hours after online publication and is updated daily on week days.
Initial download of the metrics may take a while.