Fig. 8.
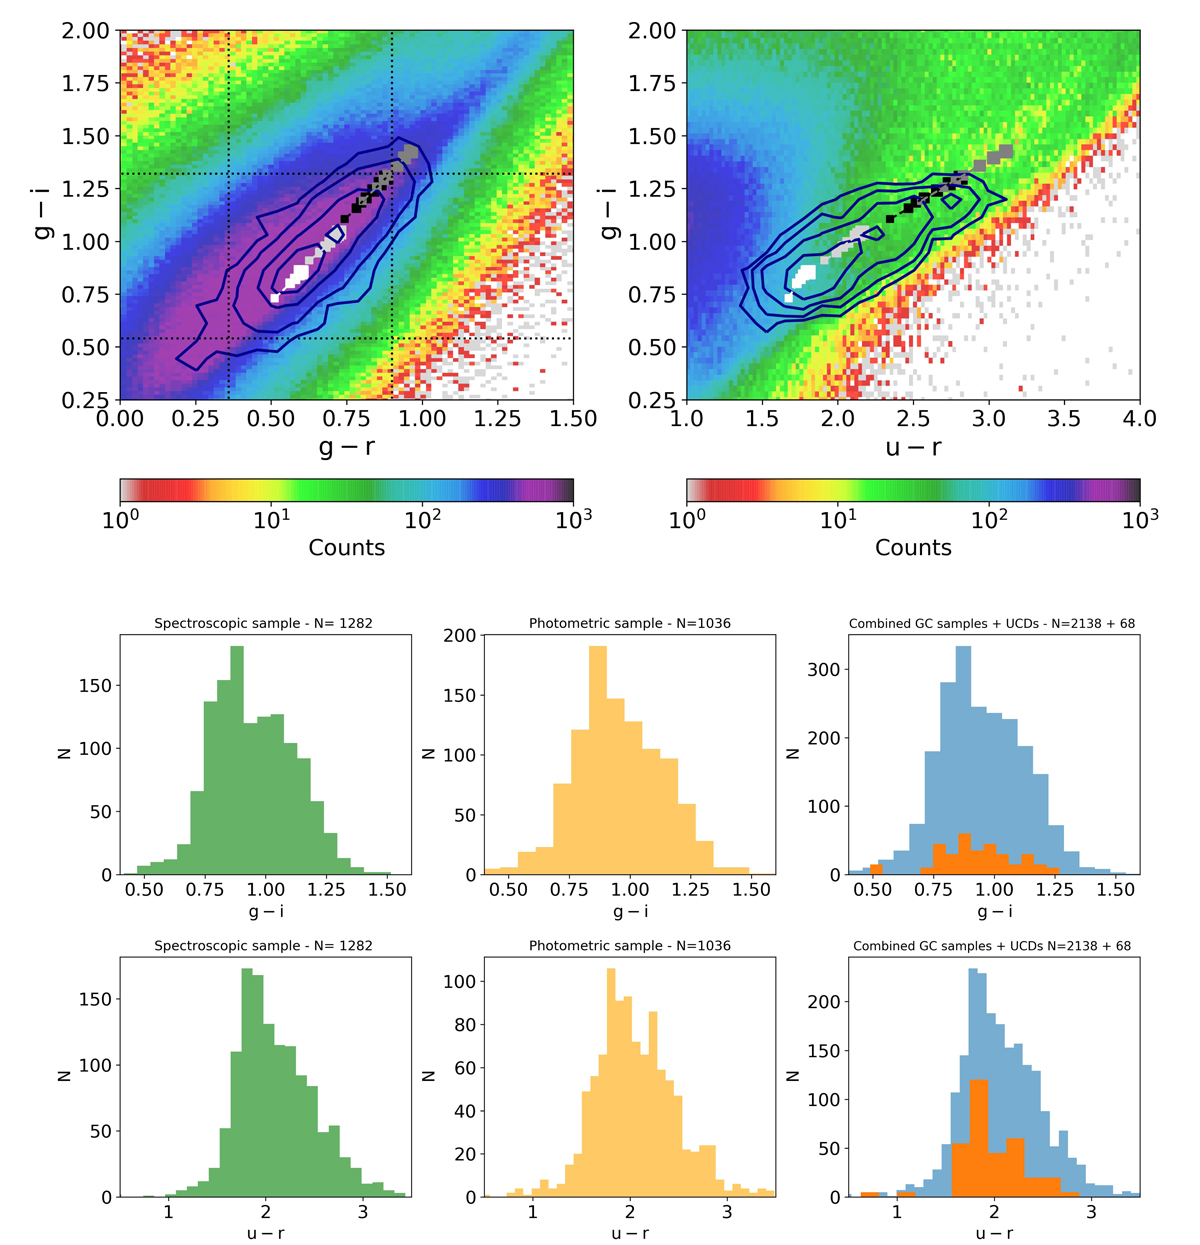
Upper panels: color–color Hess diagrams for the sample of sources with ugri photometry, over the color interval expected for GCs and UCDs. The dark-blue lines show the linear spaced contour levels of sources in the master GC catalog. Filled squares show the integrated colors from the SPoT stellar population synthesis code. White, light-gray, black, and dark-gray symbols indicate metallicity [Fe/H] = [−1.3, −0.7, 0.0, 0.4], respectively; symbols size scales with increasing model age, ranging between 4 and 14 Gyr, with 2 Gyr step. Same metallicity models are connected with dashed lines. Left color-color panel: we also draw with dotted lines the color intervals of GCs assuming ±3 − rmsMAD with respect to the median values in Table 7. Middle and lower panels: (g − i) and (u − r) color histograms, respectively, for the master spectroscopic (left panel, green histogram), photometric (middle, yellow), and combined (right, blue) GC catalogs. In the third histograms the data of UCDs are also shown (orange), expanded by a factor of five for sake of clarity. Only sources brighter than mg = 23.5 mag are considered.
Current usage metrics show cumulative count of Article Views (full-text article views including HTML views, PDF and ePub downloads, according to the available data) and Abstracts Views on Vision4Press platform.
Data correspond to usage on the plateform after 2015. The current usage metrics is available 48-96 hours after online publication and is updated daily on week days.
Initial download of the metrics may take a while.