Fig. 6.
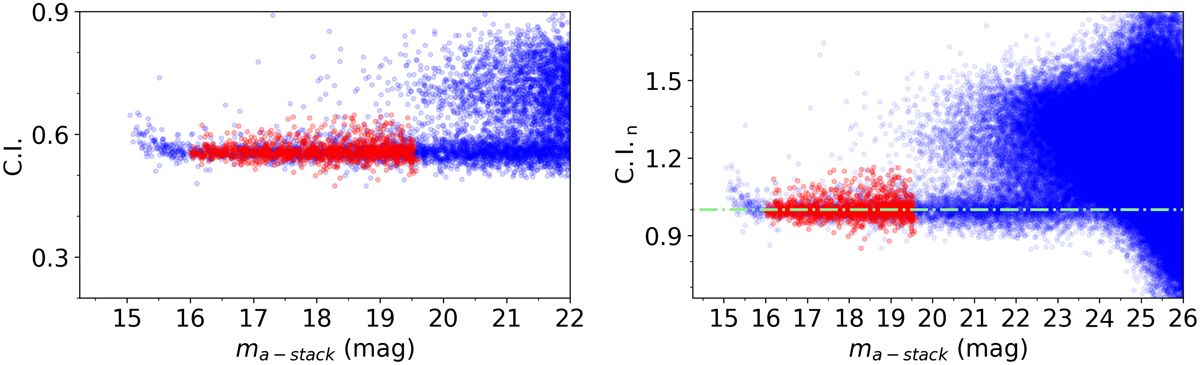
Normalization procedure for the CI, data for the field FDS#13 are shown. Left panel: concentration index CI = mag4 pix − mag6 pix versus the uncalibrated a-stack magnitude. For the sake of clarity, only the brightest magnitude range is shown. Blue dots refer to the full sample, red symbols to candidate compact sources used to derive the median CI factor for normalization. Right panel: same as left panel, but over a larger magnitude range and after normalization to the median CI of bright point-like sources (red dots). Point-like sources candidates are aligned along the sequence parallel to the x-axis, around CIn ∼ 1 (green dot-dashed line).
Current usage metrics show cumulative count of Article Views (full-text article views including HTML views, PDF and ePub downloads, according to the available data) and Abstracts Views on Vision4Press platform.
Data correspond to usage on the plateform after 2015. The current usage metrics is available 48-96 hours after online publication and is updated daily on week days.
Initial download of the metrics may take a while.