Fig. 4.
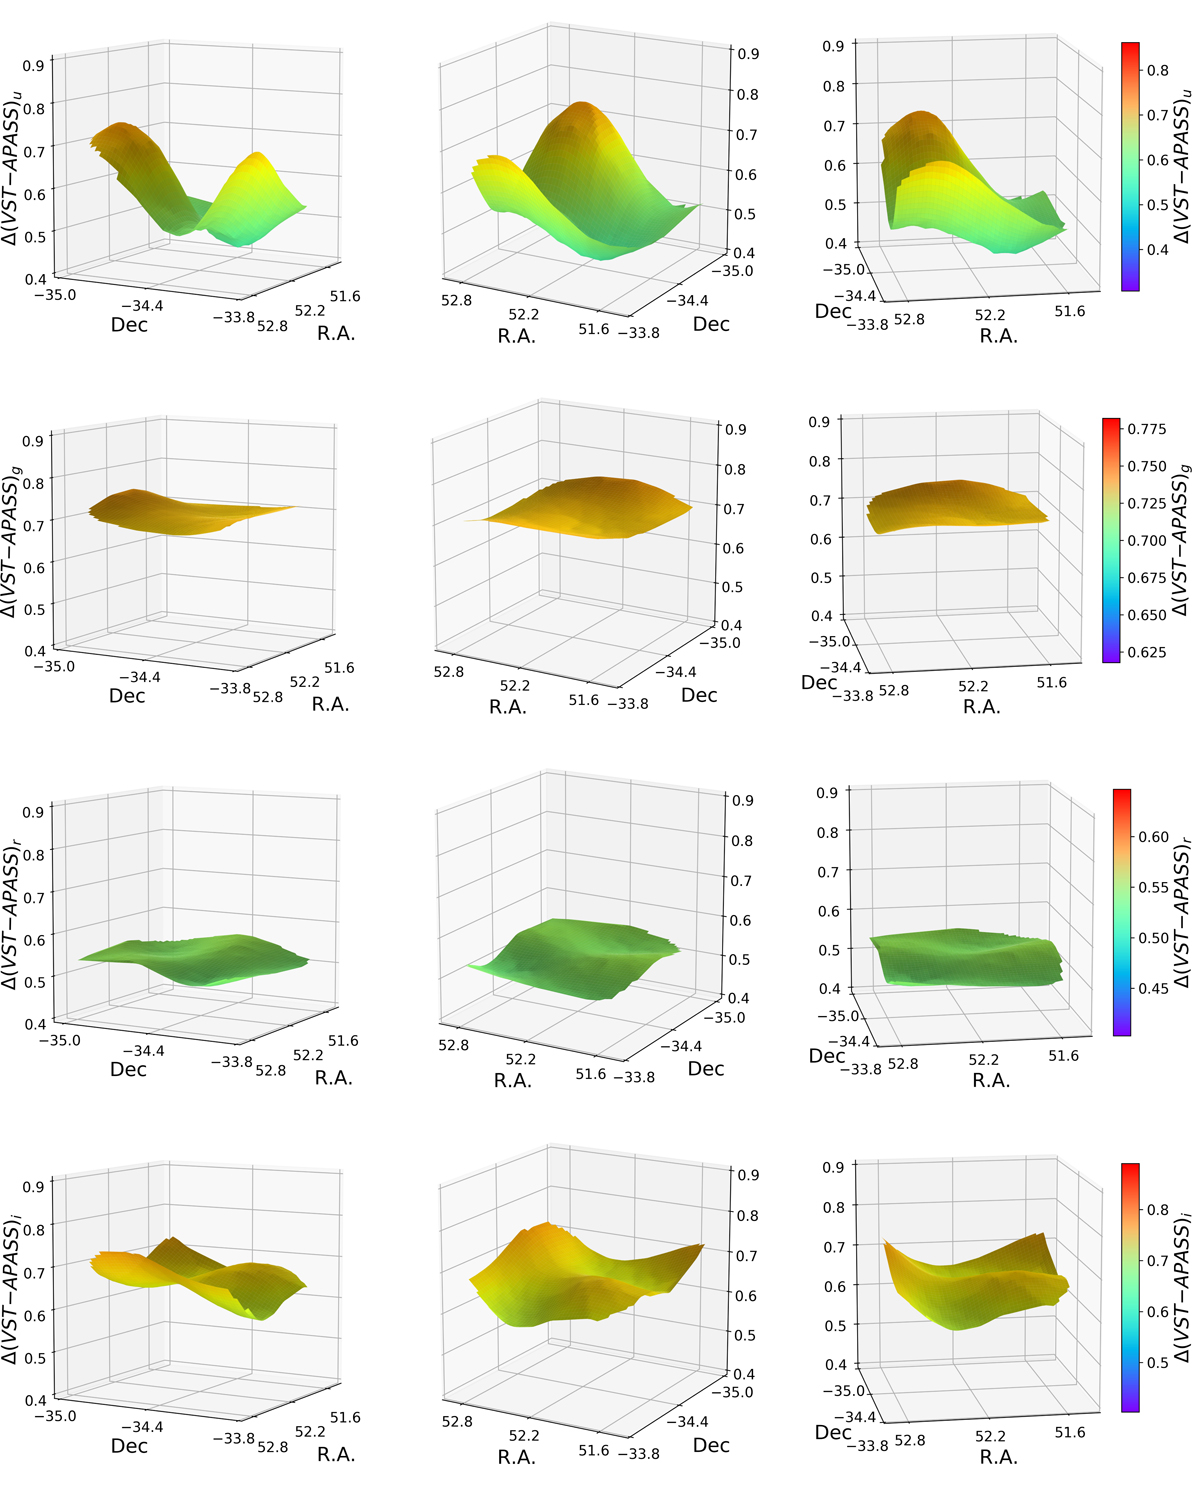
Example of the two-dimensional photometric correction maps for refining the photometry of FDS fields. The maps also include the aperture correction term. Field FDS#19 is shown: u, g, r, and i-band correction maps are plotted from upper to lower panels, respectively. For each passband, the surface correction map is shown with the same color coding and for different viewpoints in each of the three panels.
Current usage metrics show cumulative count of Article Views (full-text article views including HTML views, PDF and ePub downloads, according to the available data) and Abstracts Views on Vision4Press platform.
Data correspond to usage on the plateform after 2015. The current usage metrics is available 48-96 hours after online publication and is updated daily on week days.
Initial download of the metrics may take a while.