Free Access
Fig. 11.
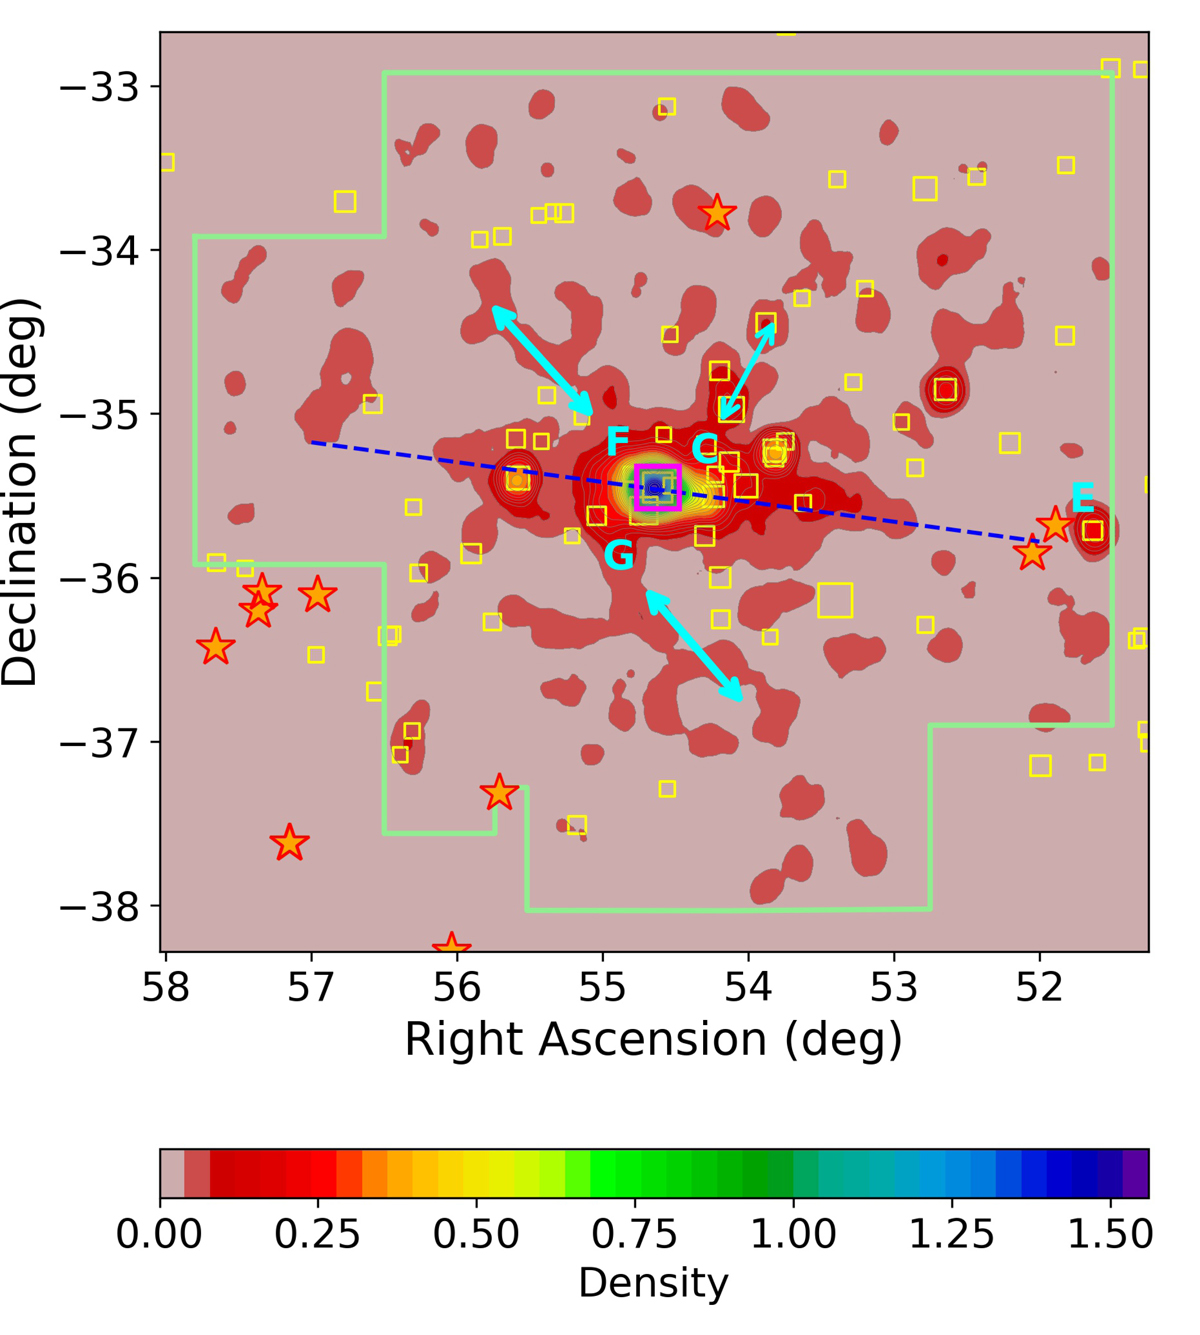
Single-panel view of the 2-D GC surface distribution. Iso-density contours and symbols are the same as in Fig. 10 (third contour level plots). Light blue arrows and labels indicate the GC overdensities discussed in the text. The blue dashed line shows the ∼10° tilt in the direction of NGC 1336 (“E” label in the figure).
Current usage metrics show cumulative count of Article Views (full-text article views including HTML views, PDF and ePub downloads, according to the available data) and Abstracts Views on Vision4Press platform.
Data correspond to usage on the plateform after 2015. The current usage metrics is available 48-96 hours after online publication and is updated daily on week days.
Initial download of the metrics may take a while.