Fig. 10.
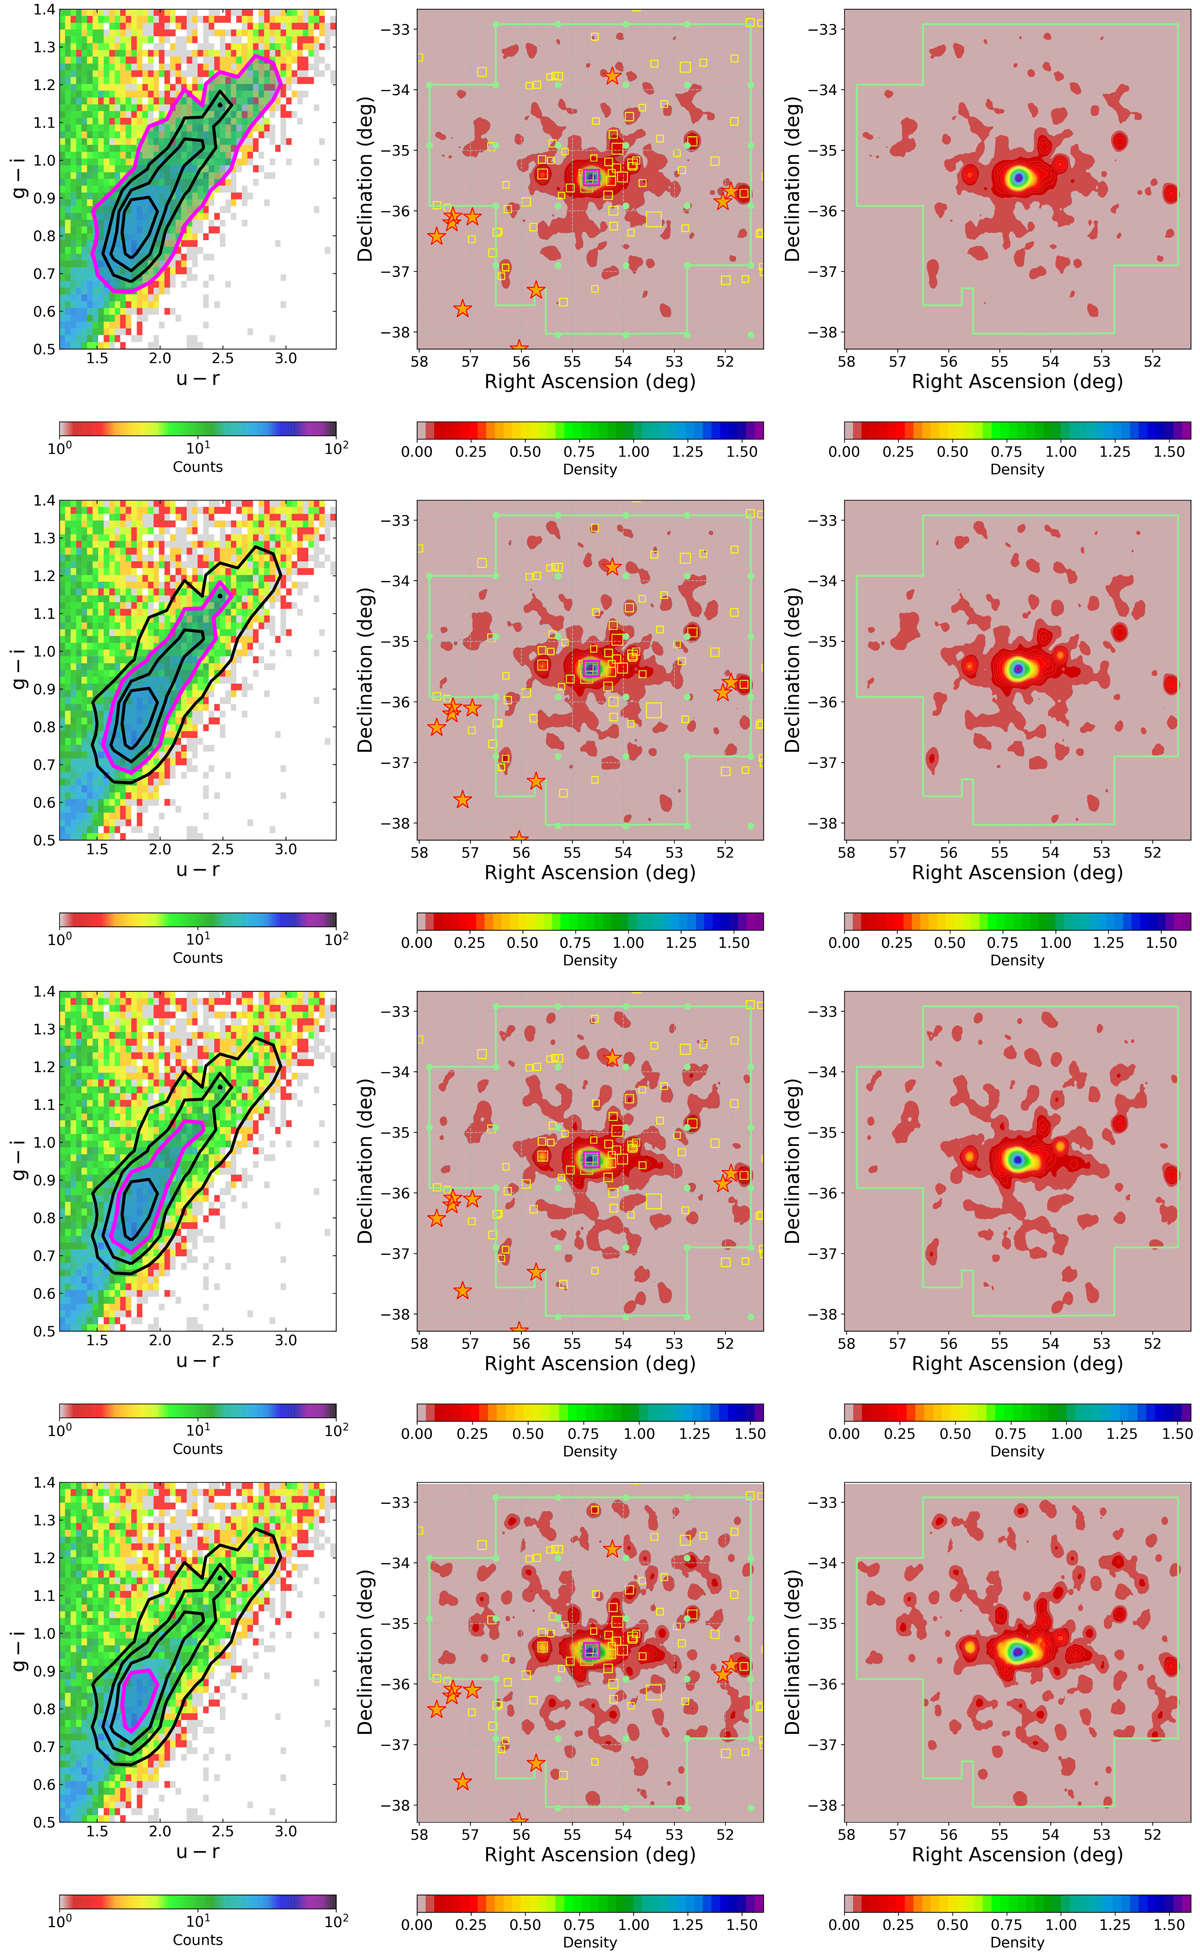
Surface density maps of GC candidates over the FDS area. Upper left panel: color-color Hess diagram for GC candidates selected using the parameters in Table 8. The contour lines refer to the master GC sample. All GC candidates in the color-color contour level shown with a thick magenta solid line (also evidenced with a gray shaded area) are used for the density maps in the middle and center panels. Upper middle panel: density map of the GC candidates within the shaded area highlighted in the left panel. The density is in number of candidates per square arcmin. East is left, north is up. The light green line shows the FDS footprint; filled green dots mark the limits of single pointings; five pointed stars mark stars with mV ≤ 7 mag; yellow squares show galaxies bcenterer than BT = 16 mag, with symbol size scaled to galaxy total magnitude; NGC 1399 is also marked with a magenta empty square. Upper center panel: as upper middle panel, except that all reference sources and lines are not plotted to highlight the GC structures in the area. Second to fourth row of panels: as upper row, but for the other narrower contour levels of the color–color diagram, as evidenced with the magenta contour in the first column of panels. From upper to lower panels: the number of GC candidates within the color–color region identified with magenta contour level is: 5.650, 3.650, 2.170, and 900, respectively.
Current usage metrics show cumulative count of Article Views (full-text article views including HTML views, PDF and ePub downloads, according to the available data) and Abstracts Views on Vision4Press platform.
Data correspond to usage on the plateform after 2015. The current usage metrics is available 48-96 hours after online publication and is updated daily on week days.
Initial download of the metrics may take a while.