Fig. 3
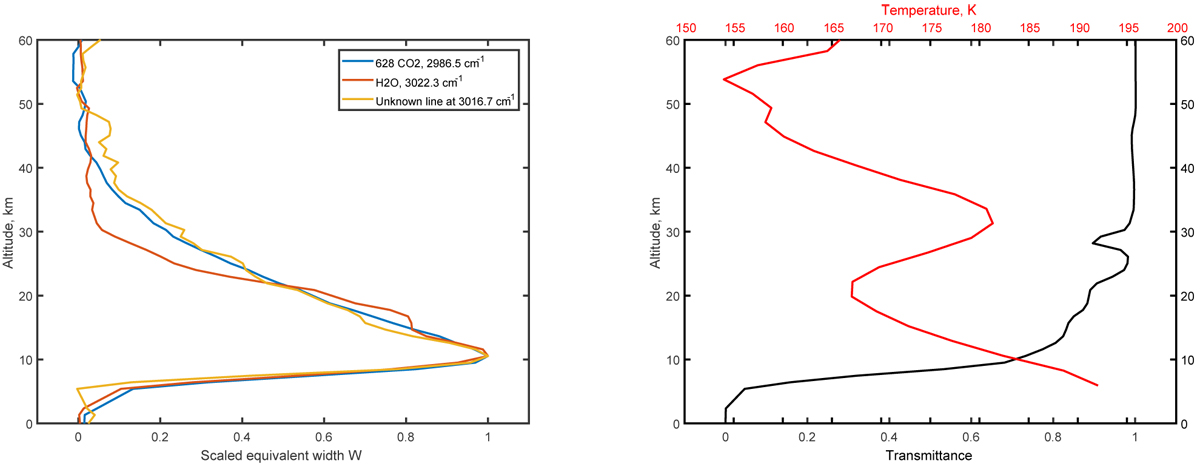
Left panel: evolution of the equivalent width of one unknown line (3016.7 cm−1) during an occultation (orange curve) against the equivalent widths of a neighbouring H2O line (3022.3 cm−1) from order 180 and a CO2 line (2968.5 cm−1) from order 178. Right panel: corresponding temperature profile from simultaneously observed ACS NIR data. The continuum transmittance is presented in the right panel for reference. Orbit 7326 is shown.
Current usage metrics show cumulative count of Article Views (full-text article views including HTML views, PDF and ePub downloads, according to the available data) and Abstracts Views on Vision4Press platform.
Data correspond to usage on the plateform after 2015. The current usage metrics is available 48-96 hours after online publication and is updated daily on week days.
Initial download of the metrics may take a while.