Fig. 2
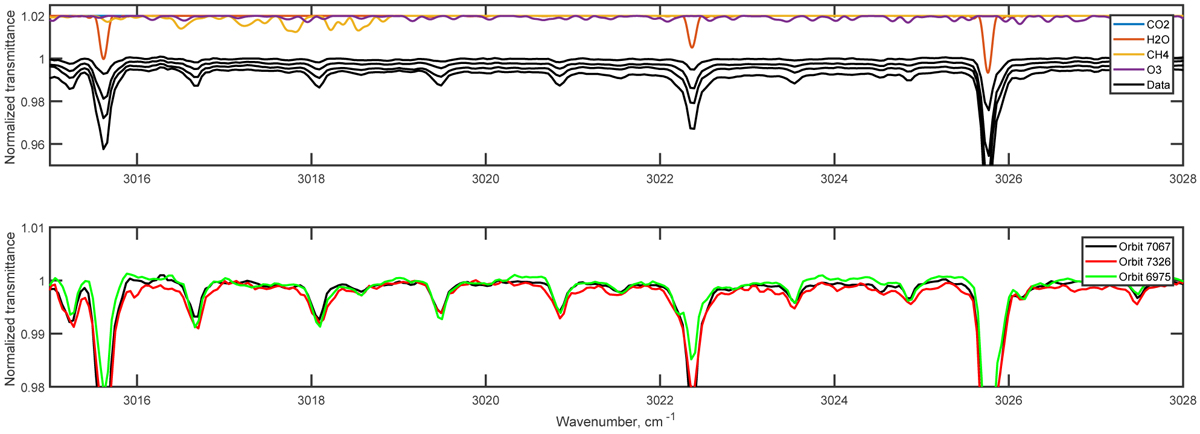
Top panel: consecutive ACS MIR transmission spectra measured in diffraction order 180 at tangent altitudes 8–18 km (orbit 7067, black curves), against synthetic models indicating potential contributions of different atmospheric components at 10 km with MIR resolution (coloured curves): 15 ppmv of water vapour, 1 ppbv of methane, and 200 ppbv of ozone. Three H2O lines and a series of periodic unidentified features are apparent. Bottom panel: similar spectra measured in three selected orbits (6975, 7067, and 7326) at tangent altitudes of 10 km.
Current usage metrics show cumulative count of Article Views (full-text article views including HTML views, PDF and ePub downloads, according to the available data) and Abstracts Views on Vision4Press platform.
Data correspond to usage on the plateform after 2015. The current usage metrics is available 48-96 hours after online publication and is updated daily on week days.
Initial download of the metrics may take a while.