Fig. 8
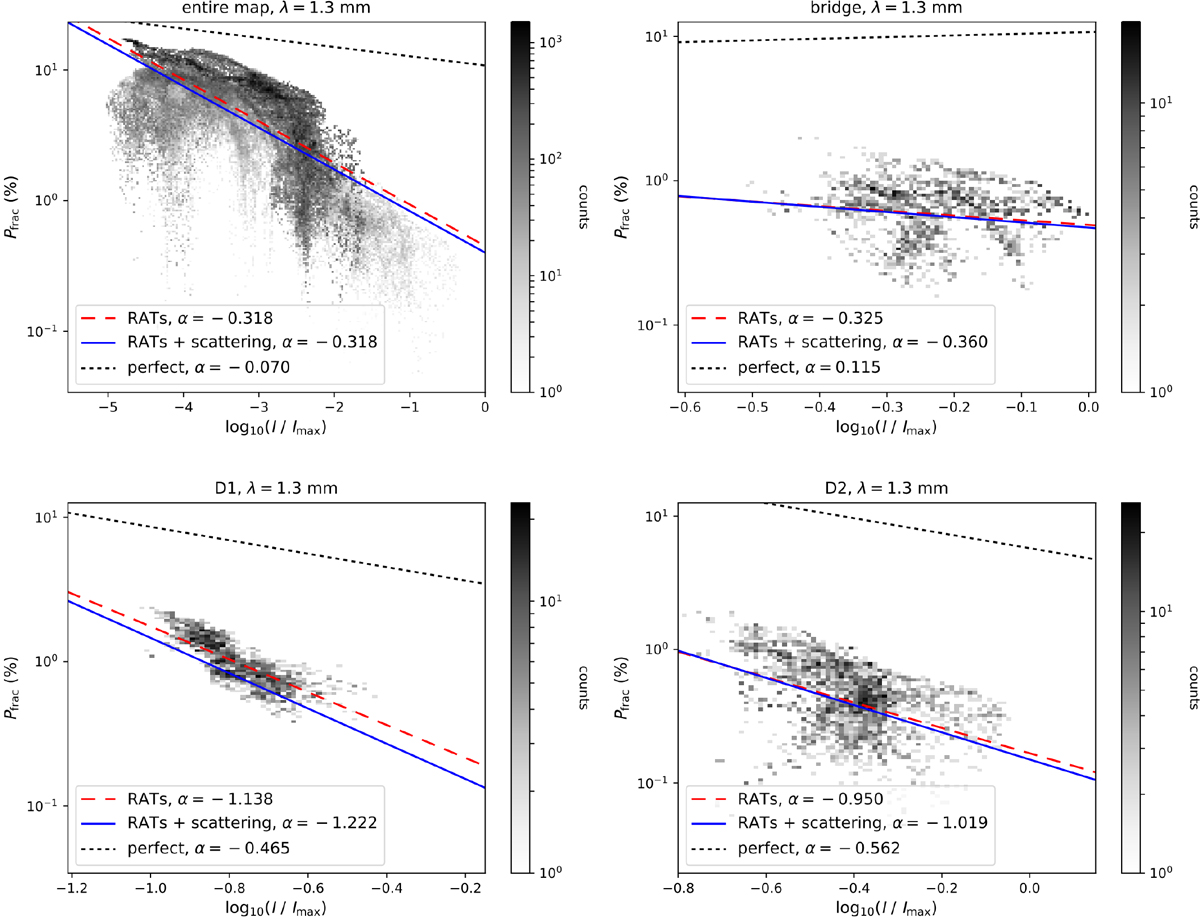
PI relation at a wavelength of 1.3 mm for the entire dust emission map (top left) shown in Fig. 6 and the regions of the bridge (top right), D1 (bottom left), and D2 (bottom right). We compare the fitted trends of the PI relation Pfrac ∝ Iα for the cases of RAT alignment (long-dashed red), RAT plus scattering (solid blue), and perfect grain alignment (short-dashed black). The gray-scaled counts represent the pixels of the maps in Fig. 6 considering only RAT alignment.
Current usage metrics show cumulative count of Article Views (full-text article views including HTML views, PDF and ePub downloads, according to the available data) and Abstracts Views on Vision4Press platform.
Data correspond to usage on the plateform after 2015. The current usage metrics is available 48-96 hours after online publication and is updated daily on week days.
Initial download of the metrics may take a while.