Fig. 3
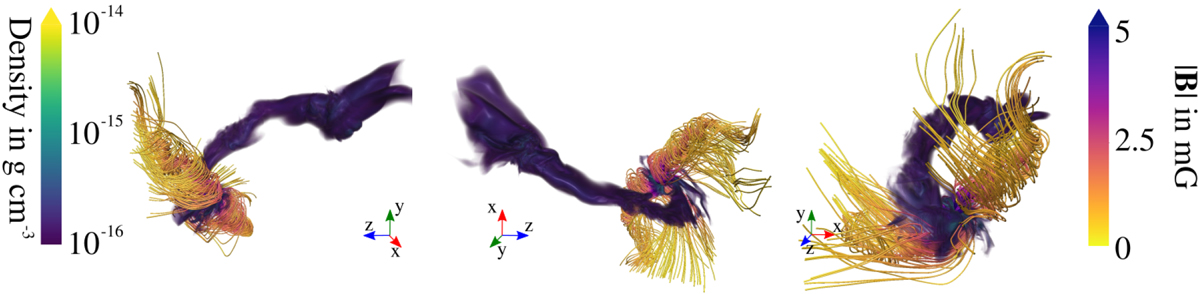
Density distribution in the bridge and around forming protostars. The panels illustrate the density distribution and the pattern of the strong magnetic fields associated with the primary in the negative direction of the axes. The bridge is shown in the left panels along the x-axis, in the middle panels along the y-axis,and in the right panels along the z-axis. The orientation is also illustrated with the red, green, and blue axes (for the x, y, and z direction). To show the bridge more clearly, we only plot densities above 10−16 g cm−3 and gradually increase the opacity of the gas from 0 to 100% for densities ρgas > 10−14 g cm−3. The illustration is based on a cubical box of 2048 AU in length around the center, computed as (rA + rC) / 2 at the time of formation of the third companion ≈4 kyr later.
Current usage metrics show cumulative count of Article Views (full-text article views including HTML views, PDF and ePub downloads, according to the available data) and Abstracts Views on Vision4Press platform.
Data correspond to usage on the plateform after 2015. The current usage metrics is available 48-96 hours after online publication and is updated daily on week days.
Initial download of the metrics may take a while.