Fig. 11
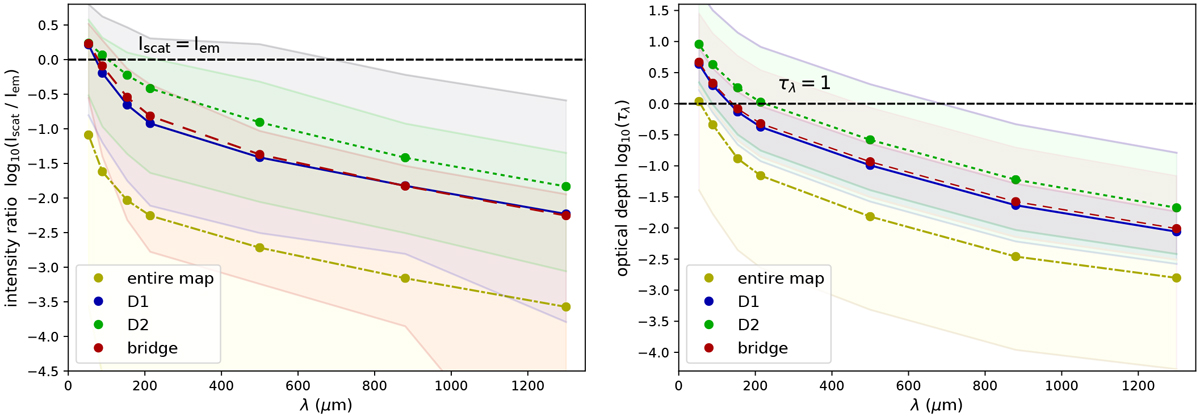
Left panel: wavelength-dependent ratio of scattered intensity Iscat to emitted intensity Iem of the entire map (dash-dotted yellow) shown in Fig. 6 assuming RAT alignment in comparison with the regions D1 (solid blue), D2 (short-dashed green), and the bridge structure (long-dashed red). Right panel: same as the right panel, but for the optical depth τλ.
Current usage metrics show cumulative count of Article Views (full-text article views including HTML views, PDF and ePub downloads, according to the available data) and Abstracts Views on Vision4Press platform.
Data correspond to usage on the plateform after 2015. The current usage metrics is available 48-96 hours after online publication and is updated daily on week days.
Initial download of the metrics may take a while.