Fig. 7
Download original image
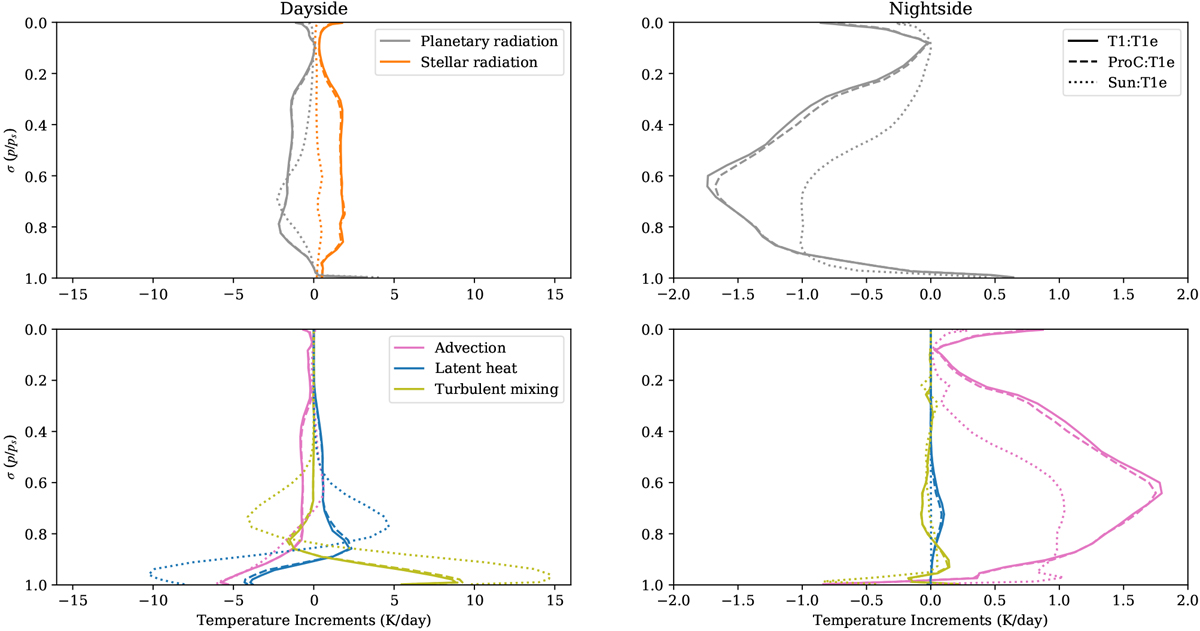
Rate of change of temperature or heating profiles, known as temperature increments, plotted against σ (pressure divided by surface pressure) for simulations T1:T1e (solid lines), ProC:T1e (dashed lines), and Sun:T1e (dotted lines) for each component process. The processes shown are atmospheric absorption of stellar radiation (orange, top panels),thermal emission or absorption of planetary radiation (grey, top panels), large-scale circulation, known as advection, (pink, bottom panels), latent heating or cooling of water (blue, bottom panels), and turbulent mixing (green, bottom panels). The day- and nightside hemispherically averaged values are shown in the left and right panels, respectively.The x-axis limits are different between the day- and nightside panels. In equilibrium the net heating is zero.
Current usage metrics show cumulative count of Article Views (full-text article views including HTML views, PDF and ePub downloads, according to the available data) and Abstracts Views on Vision4Press platform.
Data correspond to usage on the plateform after 2015. The current usage metrics is available 48-96 hours after online publication and is updated daily on week days.
Initial download of the metrics may take a while.