Fig. 6
Download original image
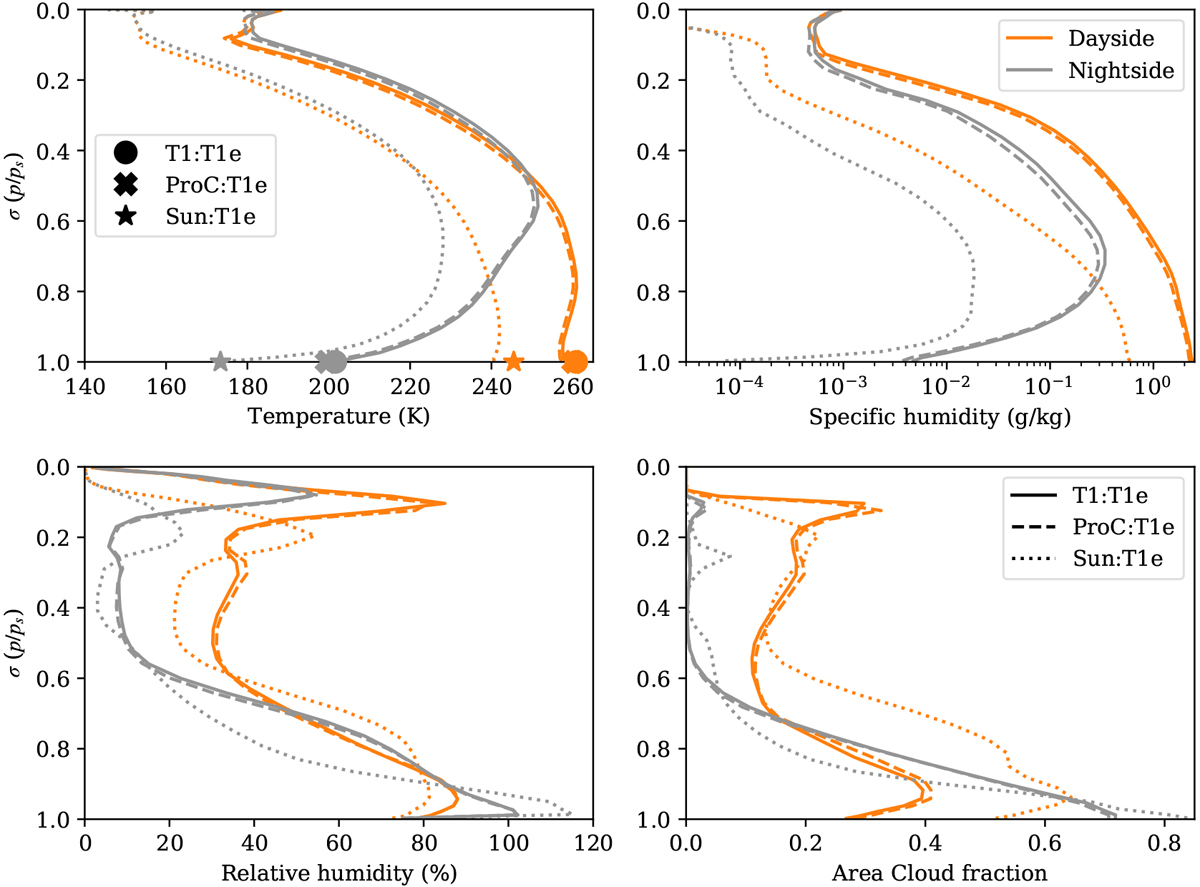
Temperature (top left), specific humidity (top right), relative humidity (bottom left), and area cloud fraction (bottom right) horizontally averaged over the dayside (orange) and nightside (grey) hemispheres, plotted against σ (pressure divided by surface pressure). These are shown for all three simulations: T1:T1e (solid line), ProC:T1e (dashed line), and Sun:T1e (dotted line). The top left panel also includes the hemisphere-averaged surface temperatures from Table 3 as a filled circle for T1:T1e, a filled cross for ProC:T1e, and a filled star for Sun:T1e.
Current usage metrics show cumulative count of Article Views (full-text article views including HTML views, PDF and ePub downloads, according to the available data) and Abstracts Views on Vision4Press platform.
Data correspond to usage on the plateform after 2015. The current usage metrics is available 48-96 hours after online publication and is updated daily on week days.
Initial download of the metrics may take a while.