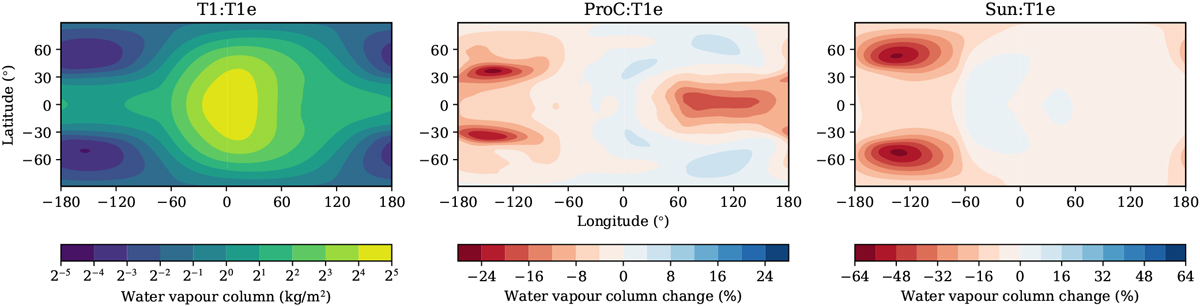
Fig. 5
Download original image
Map of the column-integrated water vapour (mass of water per cross-section area, colour scale) for the T1:T1e simulation (left). The following two plots show the change in water-vapour column content for ProC:T1e (middle) and Sun:T1e (right) with the equivalent water-vapour column content of T1:T1e if it were at the same temperature profile as ProC:T1e and Sun:T1e, respectively, at the same relative humidity as T1:T1e. The percentage is calculated from the total water-vapour content of the column. A positive difference (blue) indicates a moister column than the T1:T1e, removing the effect of temperature on moisture from the Clausius-Clapeyron relation. The sub-stellar point is located at (0°, 0°). The scale for ProC:T1e and Sun:T1e is different.
Current usage metrics show cumulative count of Article Views (full-text article views including HTML views, PDF and ePub downloads, according to the available data) and Abstracts Views on Vision4Press platform.
Data correspond to usage on the plateform after 2015. The current usage metrics is available 48-96 hours after online publication and is updated daily on week days.
Initial download of the metrics may take a while.