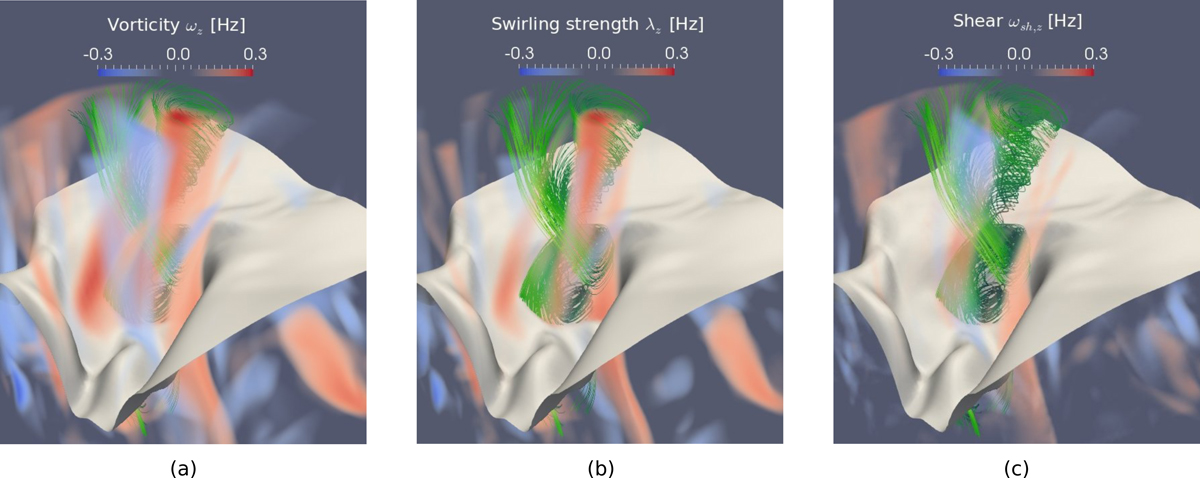
Fig. 1.

Vertical component of (a) vorticity, (b) swirling strength, and (c) shear strength, computed in a small portion of the full simulation domain, measuring 0.6 × 0.6 × 1.8 Mm3 and encompassing an intergranular region with strong vertical magnetic field (Bz ≳ 500 G). The gray sheet displays the surface of optical depth τ500 = 1, while the plasma flow is rendered with green streamlines. These images were produced with the software ParaView (Ahrens et al. 2005).
Current usage metrics show cumulative count of Article Views (full-text article views including HTML views, PDF and ePub downloads, according to the available data) and Abstracts Views on Vision4Press platform.
Data correspond to usage on the plateform after 2015. The current usage metrics is available 48-96 hours after online publication and is updated daily on week days.
Initial download of the metrics may take a while.


