Fig. 7
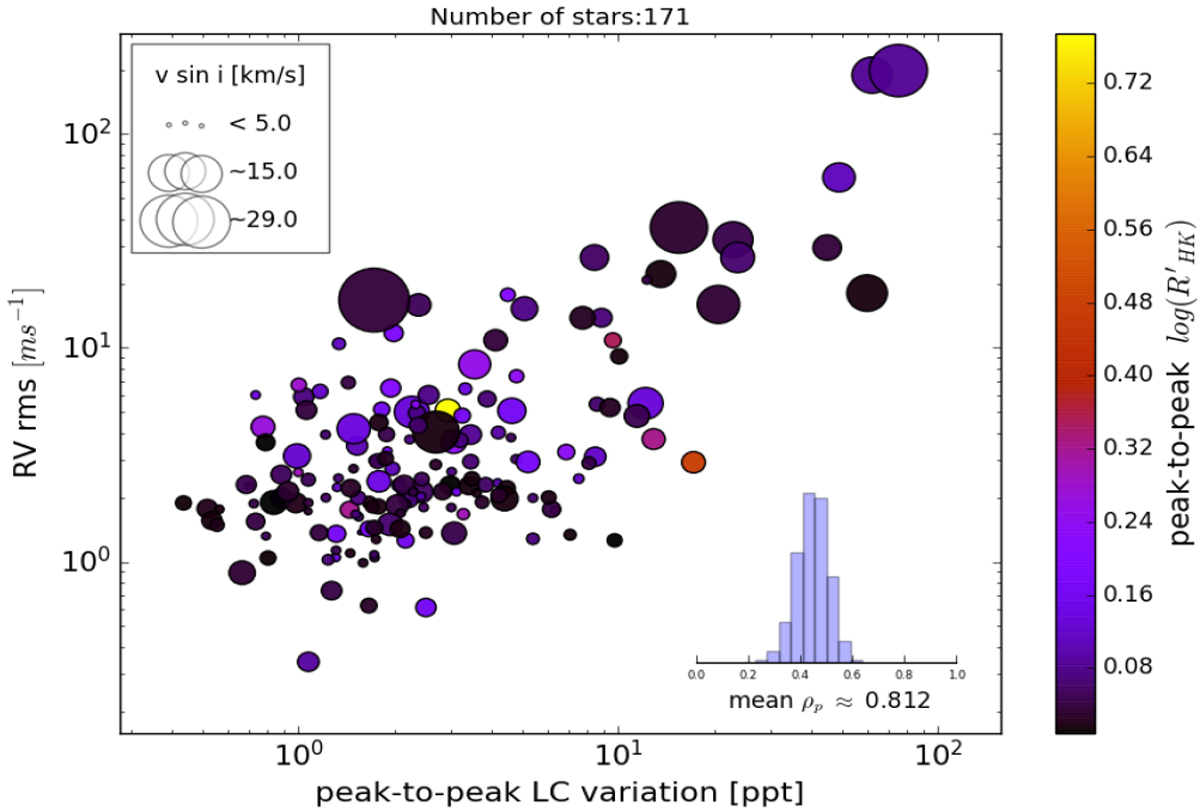
Correlation between RV-RMS and peak-to-peak of light curve variation using the all years RV sampling (whole sample). Size of the points indicate the v sin i and color represent and peak-to-peak of
![]() within the RV measurements. The points above 6 ppt have larger marker sizes and they filled up more space, thus this might cause difficulties in clearly recognizing the double law feature.
within the RV measurements. The points above 6 ppt have larger marker sizes and they filled up more space, thus this might cause difficulties in clearly recognizing the double law feature.
Current usage metrics show cumulative count of Article Views (full-text article views including HTML views, PDF and ePub downloads, according to the available data) and Abstracts Views on Vision4Press platform.
Data correspond to usage on the plateform after 2015. The current usage metrics is available 48-96 hours after online publication and is updated daily on week days.
Initial download of the metrics may take a while.