Fig. 6
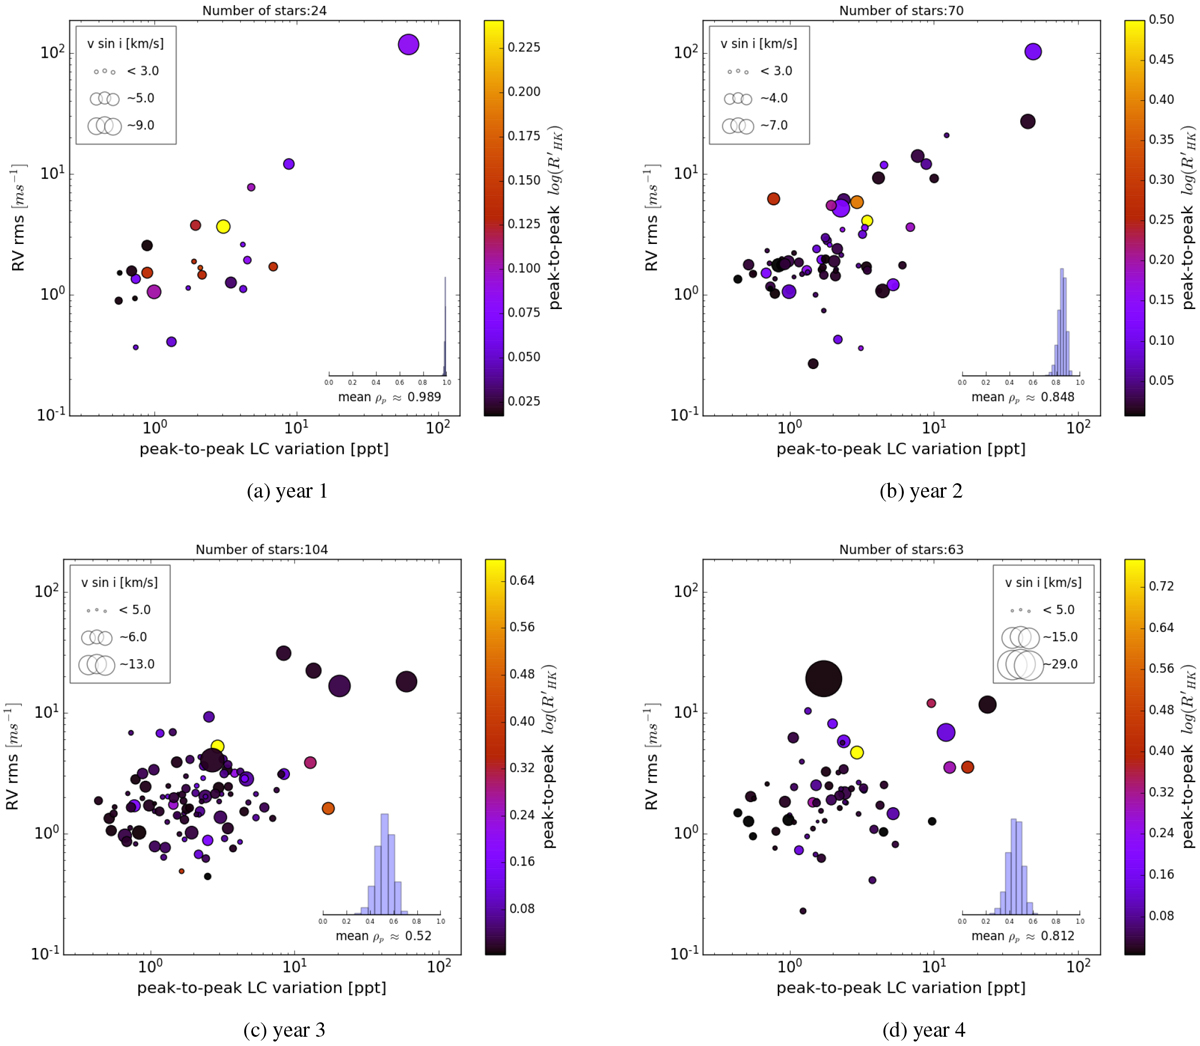
RV-RMS versus photometric variability (peak-to-peak of light curve) for the year 1 (a), year 2 (b), year 3 (c) and year 4 (d) RV measurements sampling. Color bars present the peak-to-peak variation of
![]() during the whole HARPS observations and the size-scale presents the estimation of the average v sin i derived from the CCF FWHM described in Sect. 3.1. The calculated value of correlation coefficient ρsp and its posterior distribution is presented in each panel.
during the whole HARPS observations and the size-scale presents the estimation of the average v sin i derived from the CCF FWHM described in Sect. 3.1. The calculated value of correlation coefficient ρsp and its posterior distribution is presented in each panel.
Current usage metrics show cumulative count of Article Views (full-text article views including HTML views, PDF and ePub downloads, according to the available data) and Abstracts Views on Vision4Press platform.
Data correspond to usage on the plateform after 2015. The current usage metrics is available 48-96 hours after online publication and is updated daily on week days.
Initial download of the metrics may take a while.