Free Access
Fig. 14
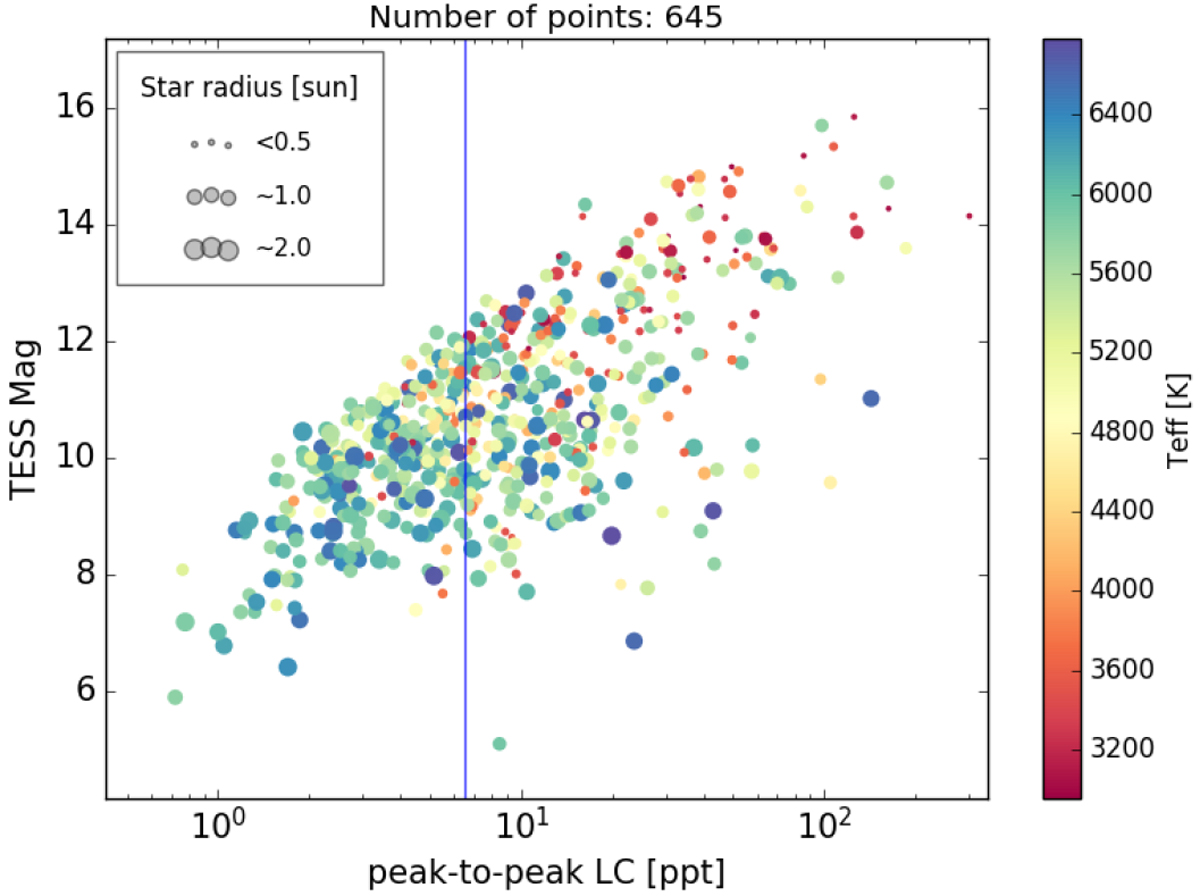
Peak-to-peak of light curve versus TESS mag. Color bar shows the stellar effective temperature and size shows the stellar radius. The Blue vertical line shows the knee point presented in Fig. 9 in peak-to-peak light curve variation at 6.5 ppt.
Current usage metrics show cumulative count of Article Views (full-text article views including HTML views, PDF and ePub downloads, according to the available data) and Abstracts Views on Vision4Press platform.
Data correspond to usage on the plateform after 2015. The current usage metrics is available 48-96 hours after online publication and is updated daily on week days.
Initial download of the metrics may take a while.