Fig. 13
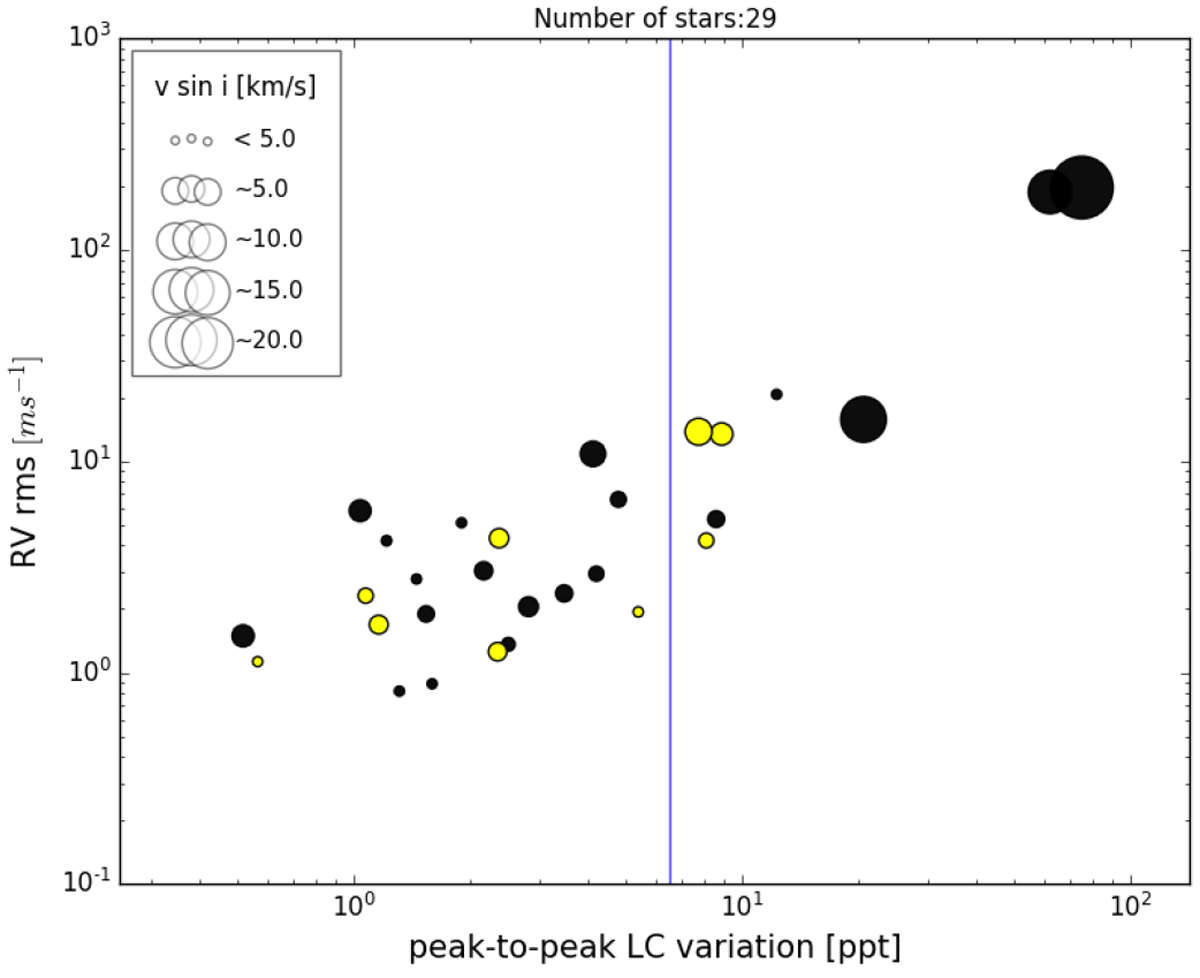
RV-RMS and the peak-to-peak of light curve variation for the subsample of 20 stars with spot dominance and 9 stars with faculae dominance in their light curves. Circle sizes represents the v sin i value determined spectroscopically. Black color indicates spot dominated and yellow indicates faculae dominated. The Blue vertical line shows the knee point presented inFig. 9 in peak-to-peak light curve variation at 6.5 ppt.
Current usage metrics show cumulative count of Article Views (full-text article views including HTML views, PDF and ePub downloads, according to the available data) and Abstracts Views on Vision4Press platform.
Data correspond to usage on the plateform after 2015. The current usage metrics is available 48-96 hours after online publication and is updated daily on week days.
Initial download of the metrics may take a while.