Fig. 12
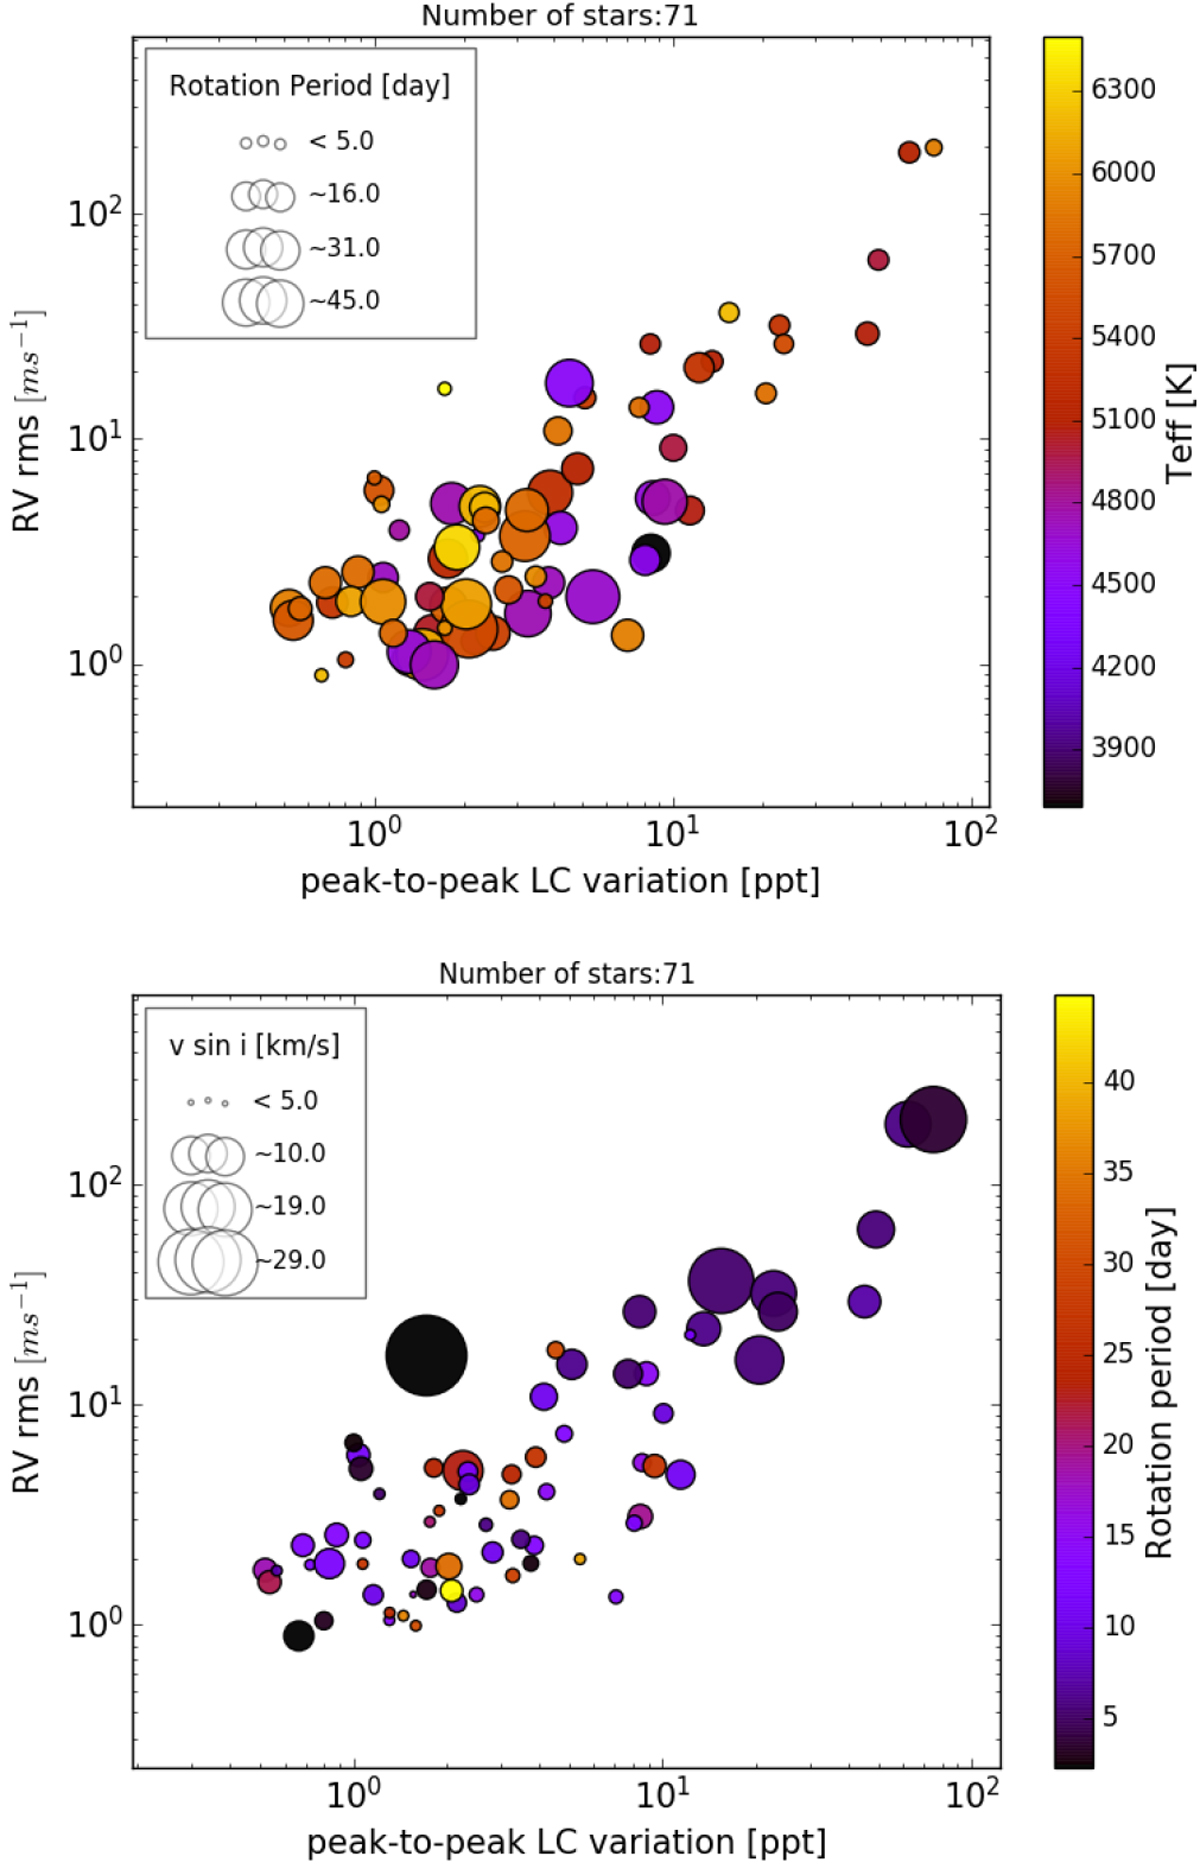
RV-RMS and peak-to-peak of light curve variation for the subsample of 71 stars. Top plot: circle sizes represents the value of rotation period found by GPS method, see Table. C.1. Color bar indicates the stellar effective temperature. Bottom plot: similar than top panel but, color bar indicates the rotation period value, and circle size the v sin i obtained spectroscopically.
Current usage metrics show cumulative count of Article Views (full-text article views including HTML views, PDF and ePub downloads, according to the available data) and Abstracts Views on Vision4Press platform.
Data correspond to usage on the plateform after 2015. The current usage metrics is available 48-96 hours after online publication and is updated daily on week days.
Initial download of the metrics may take a while.