Free Access
Fig. 1
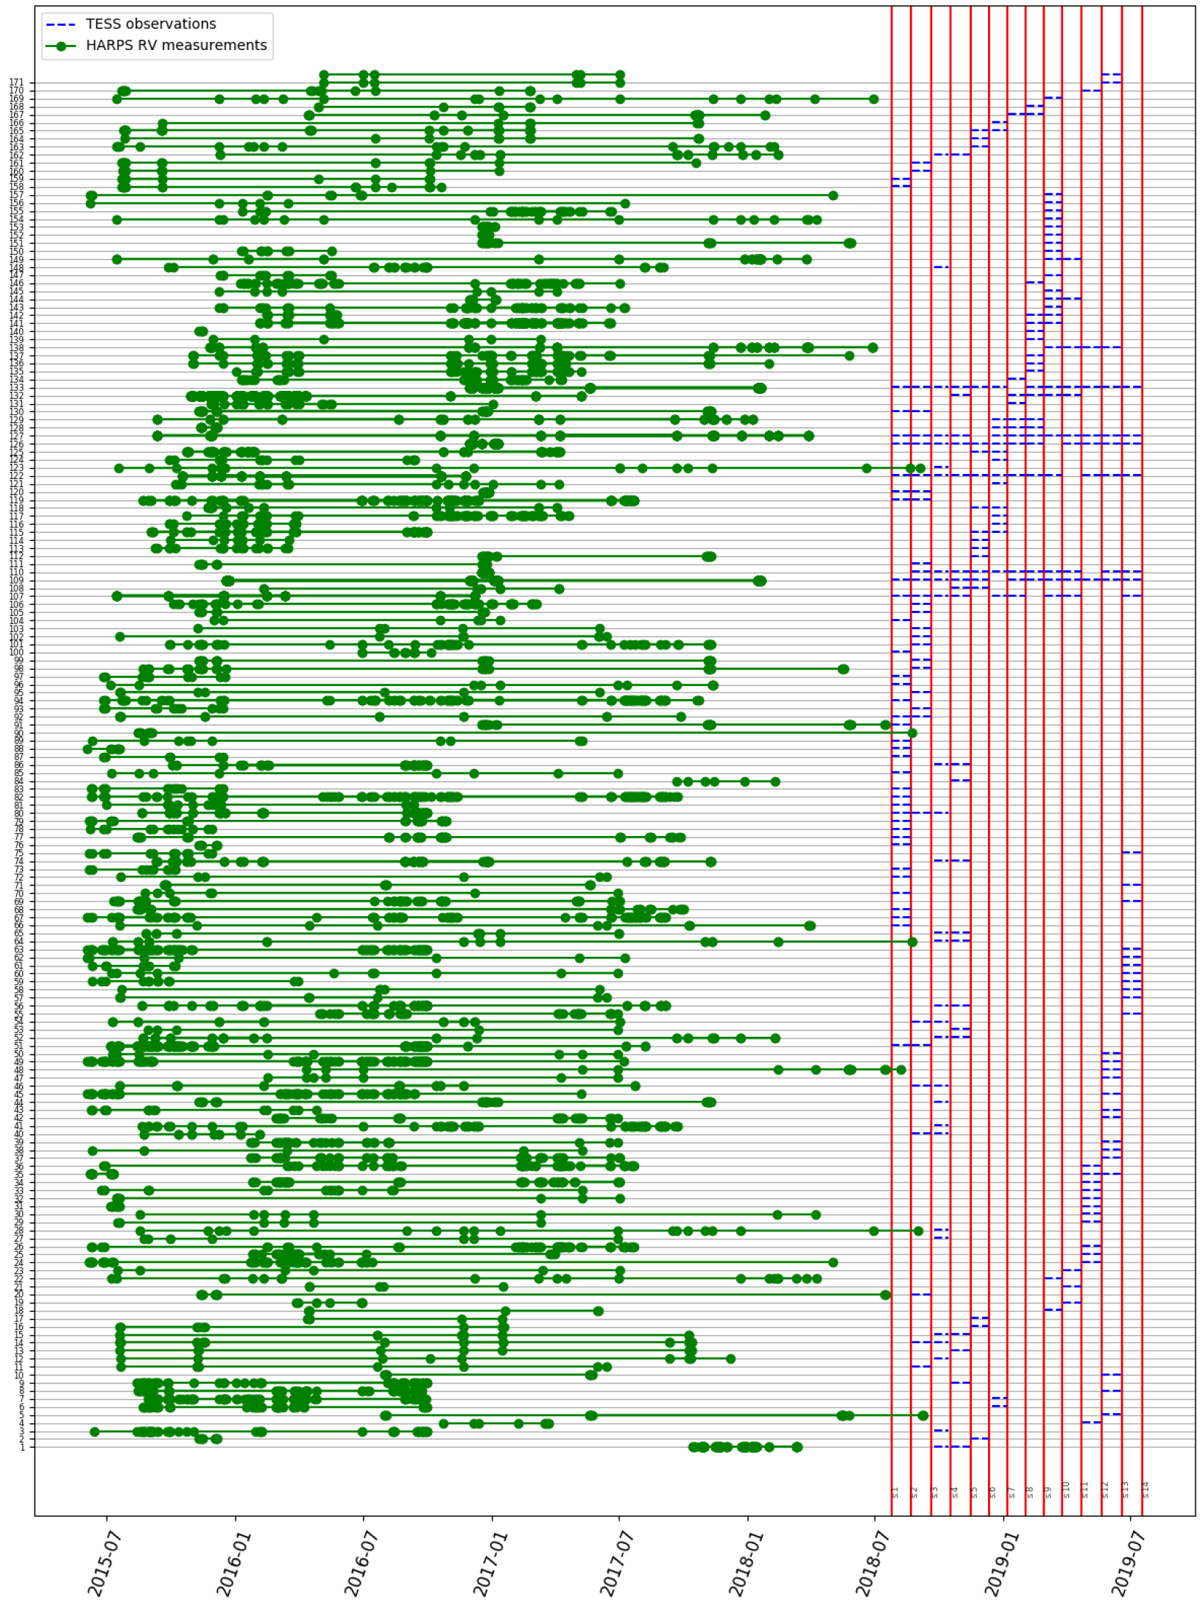
Total RV measurements and TESS observation windows. The green points show the RV measurements dates. Blue dash and red vertical lines show the TESS observations and sectors, respectively. The name of each star is presented in Table. C.1 using index number in y-axis.
Current usage metrics show cumulative count of Article Views (full-text article views including HTML views, PDF and ePub downloads, according to the available data) and Abstracts Views on Vision4Press platform.
Data correspond to usage on the plateform after 2015. The current usage metrics is available 48-96 hours after online publication and is updated daily on week days.
Initial download of the metrics may take a while.