Fig. 9.
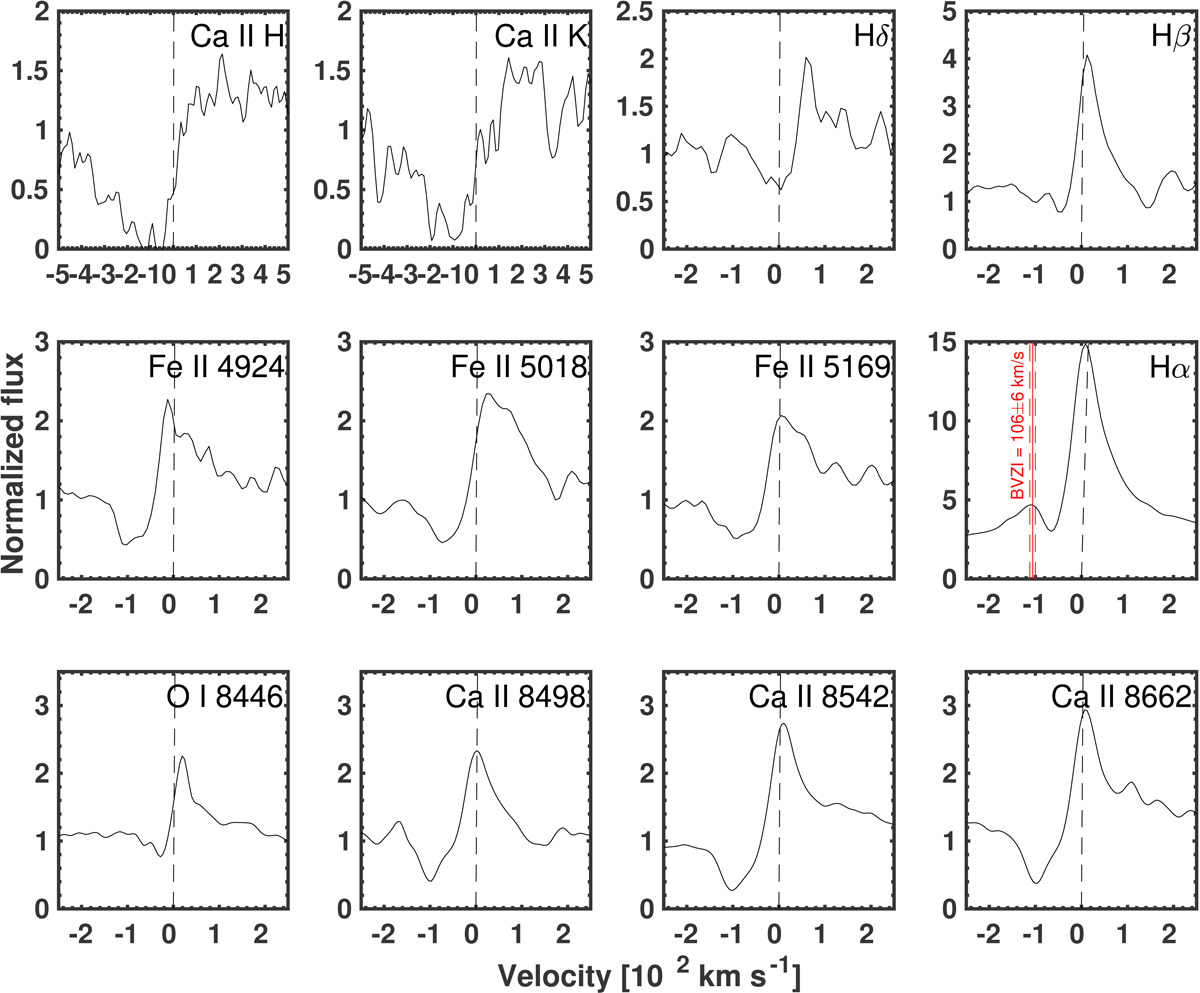
AT 2014ej line profiles of prominent emission lines in the medium-resolution MIKE spectrum (see Fig. 8), plotted in velocity space. This includes Ca II H&K, Balmer lines of Hδ, Hβ, and Hα, the Fe II multiplet 42, O I λ8446, and the Ca II NIR triplet. The vertical dotted lines mark the rest-velocity positions of the ions. The red line in the Hα panel marks the BVZI of 106 ± 6 km s−1.
Current usage metrics show cumulative count of Article Views (full-text article views including HTML views, PDF and ePub downloads, according to the available data) and Abstracts Views on Vision4Press platform.
Data correspond to usage on the plateform after 2015. The current usage metrics is available 48-96 hours after online publication and is updated daily on week days.
Initial download of the metrics may take a while.