Fig. 7.
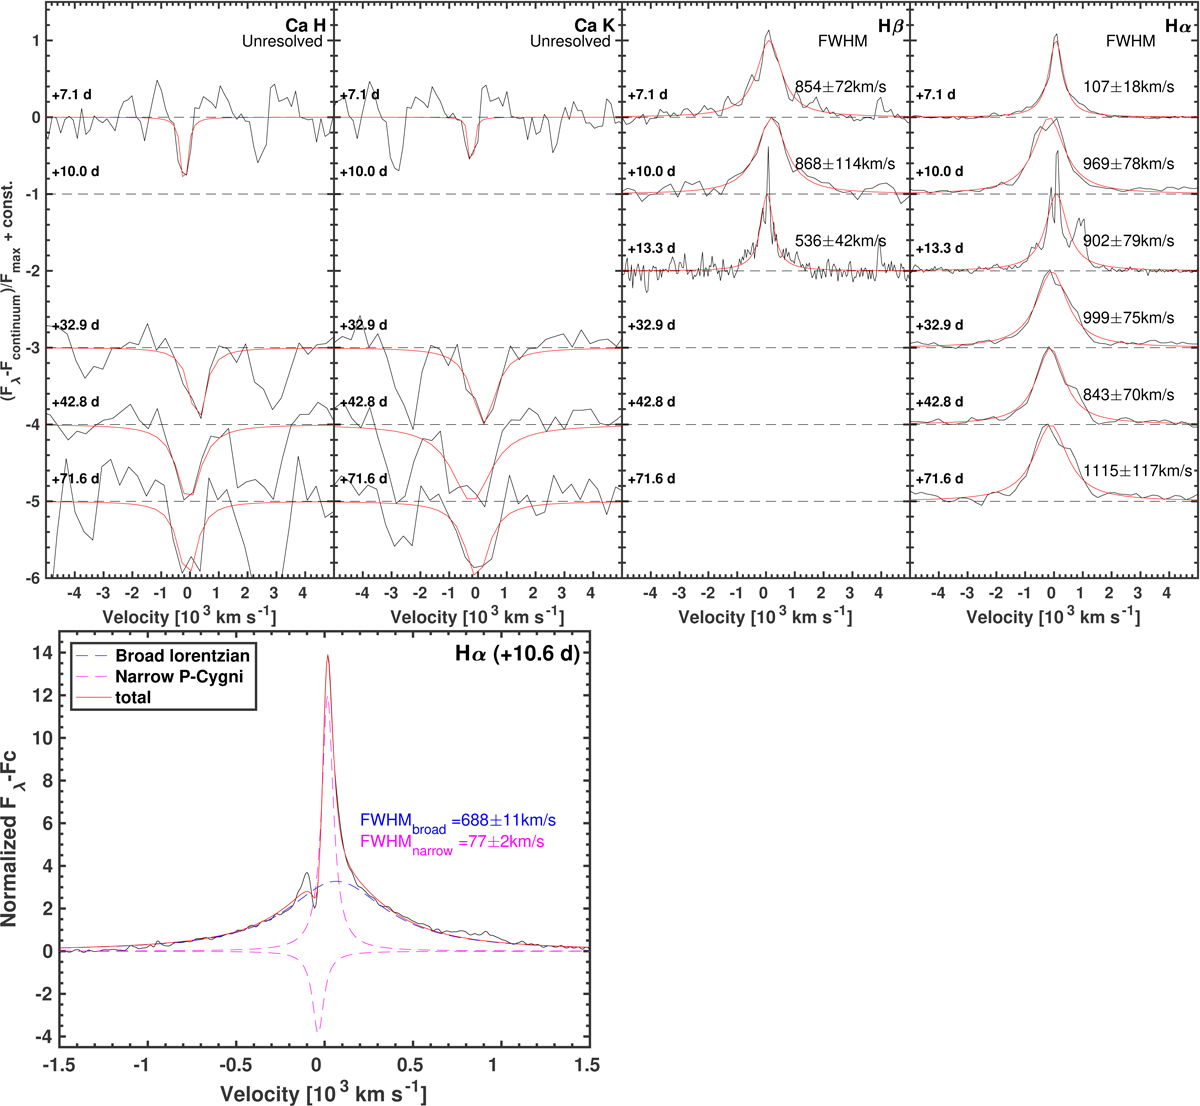
Top: spectral features of AT 2014ej including the Ca II H&K, Hβ, and Hα lines. The continuum of each spectrum was fit using a low-order polynomial and was subtracted from the data. The Lorentzian line profile fits are overplotted with a red line, and the corresponding line velocities are listed and also provided in Table 11. Bottom: MIKE spectrum around Hα in velocity space. The profile is well fit by two components consisting of a broad Lorentzian and a narrow P Cygni profile (sum of two Lorentzians with the same width) whose FWHMs are reported in the figure.
Current usage metrics show cumulative count of Article Views (full-text article views including HTML views, PDF and ePub downloads, according to the available data) and Abstracts Views on Vision4Press platform.
Data correspond to usage on the plateform after 2015. The current usage metrics is available 48-96 hours after online publication and is updated daily on week days.
Initial download of the metrics may take a while.