Fig. 6.
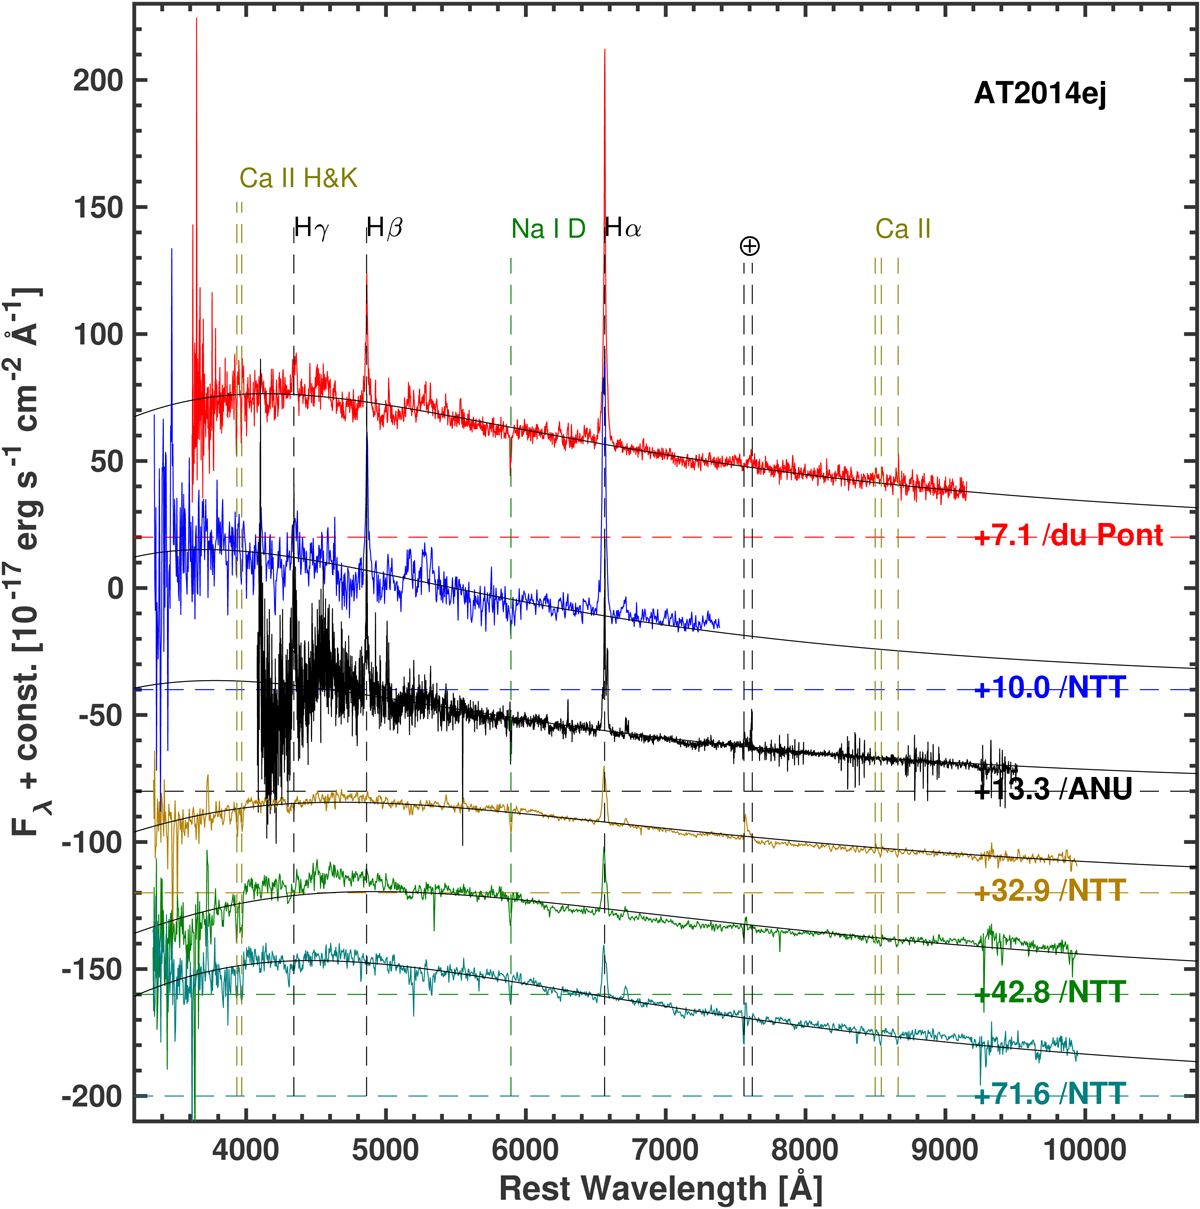
Low-resolution reddening-corrected visual wavelength spectra of AT 2014ej plotted in the rest-frame. The spectra are offset from one another in flux space by the addition of an arbitrary constant for presentation purposes. Epochs of observations relative to the discovery date are provided, along with the labeling of key spectral features, and the positions of two prevalent telluric features are indicated with an Earth symbol. The solid black lines correspond to BB fits. The BB fits exclude the wavelength ranges that contain strong emission lines.
Current usage metrics show cumulative count of Article Views (full-text article views including HTML views, PDF and ePub downloads, according to the available data) and Abstracts Views on Vision4Press platform.
Data correspond to usage on the plateform after 2015. The current usage metrics is available 48-96 hours after online publication and is updated daily on week days.
Initial download of the metrics may take a while.