Fig. 5.
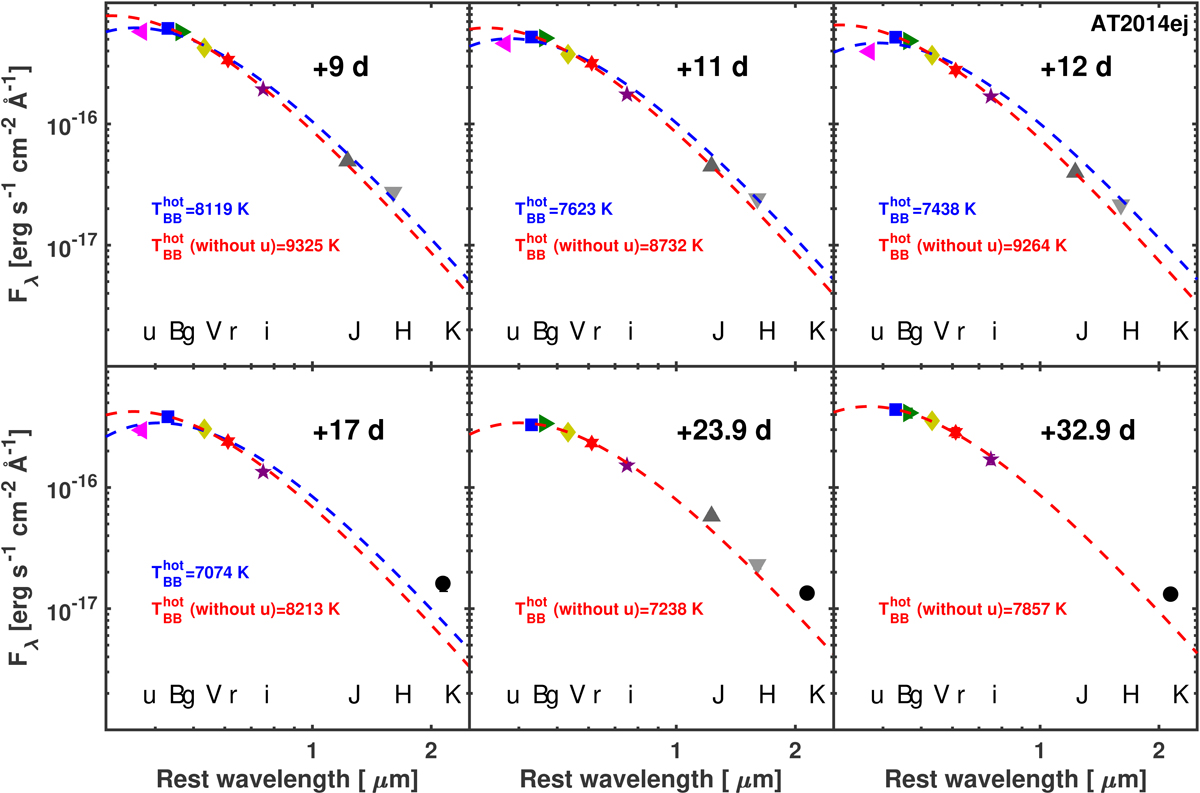
SEDs of AT 2014ej, constructed with uBgVri- and JHKs-band flux points for the six epochs where at least some NIR observations are available. The phase of each SED is reported in black in each panel. The flux points are fit with a single BB function including (dashed blue line) and excluding (dashed red line) the u-band flux measurement. The three epochs of Ks-band flux points suggest an excess of flux relative to the best-fit single BB function, and this applies regardless of whether the u-band flux point is included in the fit. This Ks-band excess could be indicative of dust emission, but without MIR coverage, it is difficult to be conclusive.
Current usage metrics show cumulative count of Article Views (full-text article views including HTML views, PDF and ePub downloads, according to the available data) and Abstracts Views on Vision4Press platform.
Data correspond to usage on the plateform after 2015. The current usage metrics is available 48-96 hours after online publication and is updated daily on week days.
Initial download of the metrics may take a while.