Fig. 2.
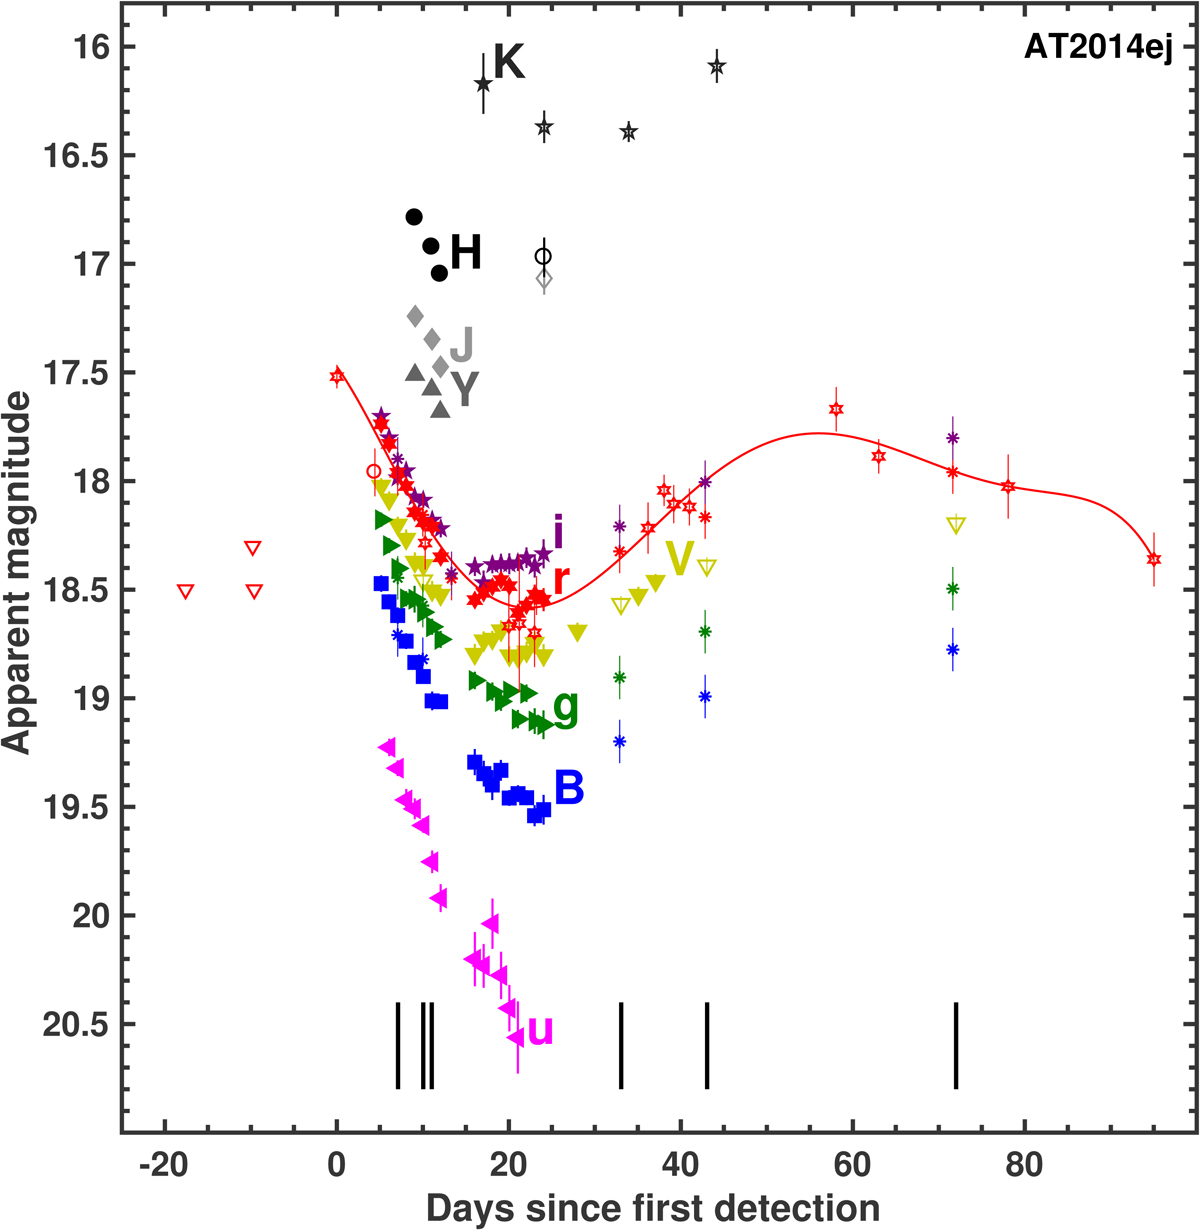
Optical and NIR light curves of AT 2014ej. The light curves decline rapidly over the first ∼20 days when they appear to reach a minimum and then evolve to a second peak (around 60 days in r band). The open red circle is the BOSS discovery magnitude, while open red triangles at 18.5 mag correspond to nondetection limits reported by Bock et al. (2014), and the open red triangle at 18.3 is a nondetection limit determined from an unfiltered CHASE image. Open red stars are CHASE photometry, and open yellow triangles and open symbols in the NIR bands are PESSTO (EFOSC2 and SOFI) photometry (V, J, H, K). Colored asterisks are spectrophometry (B, g, r, i). The other colored filled markers are CSP-II photometry. The optical r-band light curve is fit with a low-order polynomial shown as a solid red line. Optical spectral phases are marked by black segments.
Current usage metrics show cumulative count of Article Views (full-text article views including HTML views, PDF and ePub downloads, according to the available data) and Abstracts Views on Vision4Press platform.
Data correspond to usage on the plateform after 2015. The current usage metrics is available 48-96 hours after online publication and is updated daily on week days.
Initial download of the metrics may take a while.