Fig. A.1.
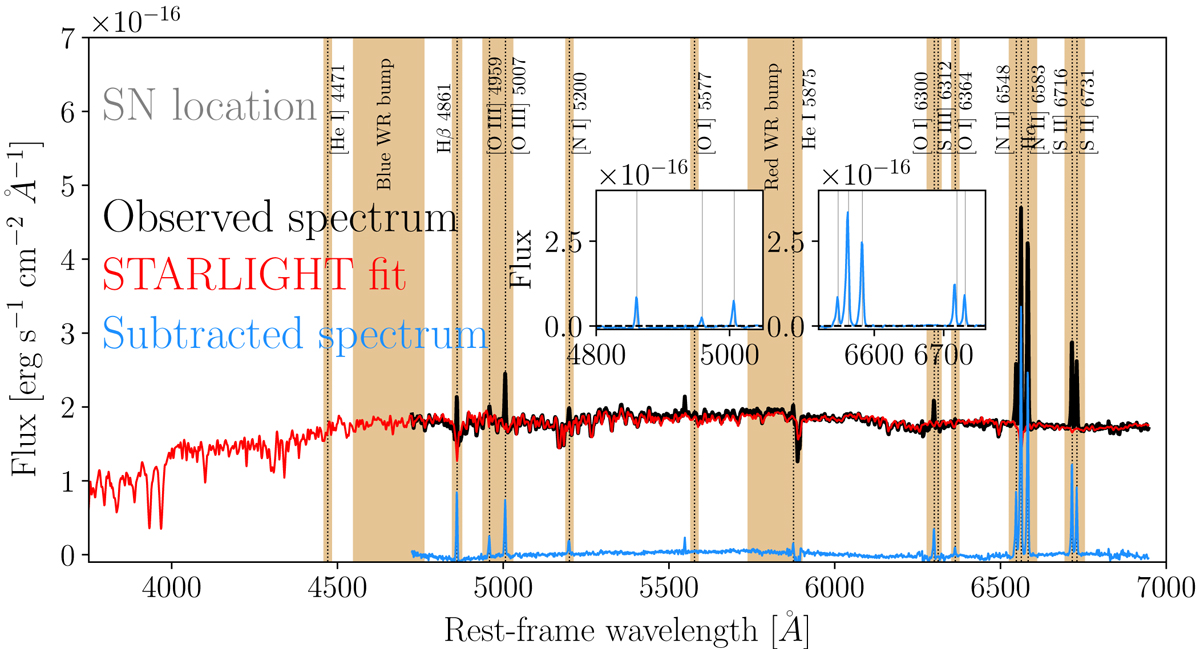
Visual wavelength MUSE spectrum at +390 d at the site of AT 2014ej in NGC 7552, shown in the host-galaxy rest frame and plotted in black. Prominent host nebular emission features are shown in blue and are labeled, and each fit with a single-Gaussian function after the background computed by STARLIGHT (red line) was subtracted. The nebular lines that are also shown in the insets provide flux ratios indicating a super-solar metallicity (12 + log(O/H) > 8.7 ± 0.2 dex) on the O3N2 index at the location of AT 2014ej.
Current usage metrics show cumulative count of Article Views (full-text article views including HTML views, PDF and ePub downloads, according to the available data) and Abstracts Views on Vision4Press platform.
Data correspond to usage on the plateform after 2015. The current usage metrics is available 48-96 hours after online publication and is updated daily on week days.
Initial download of the metrics may take a while.