Free Access
Fig. 11.
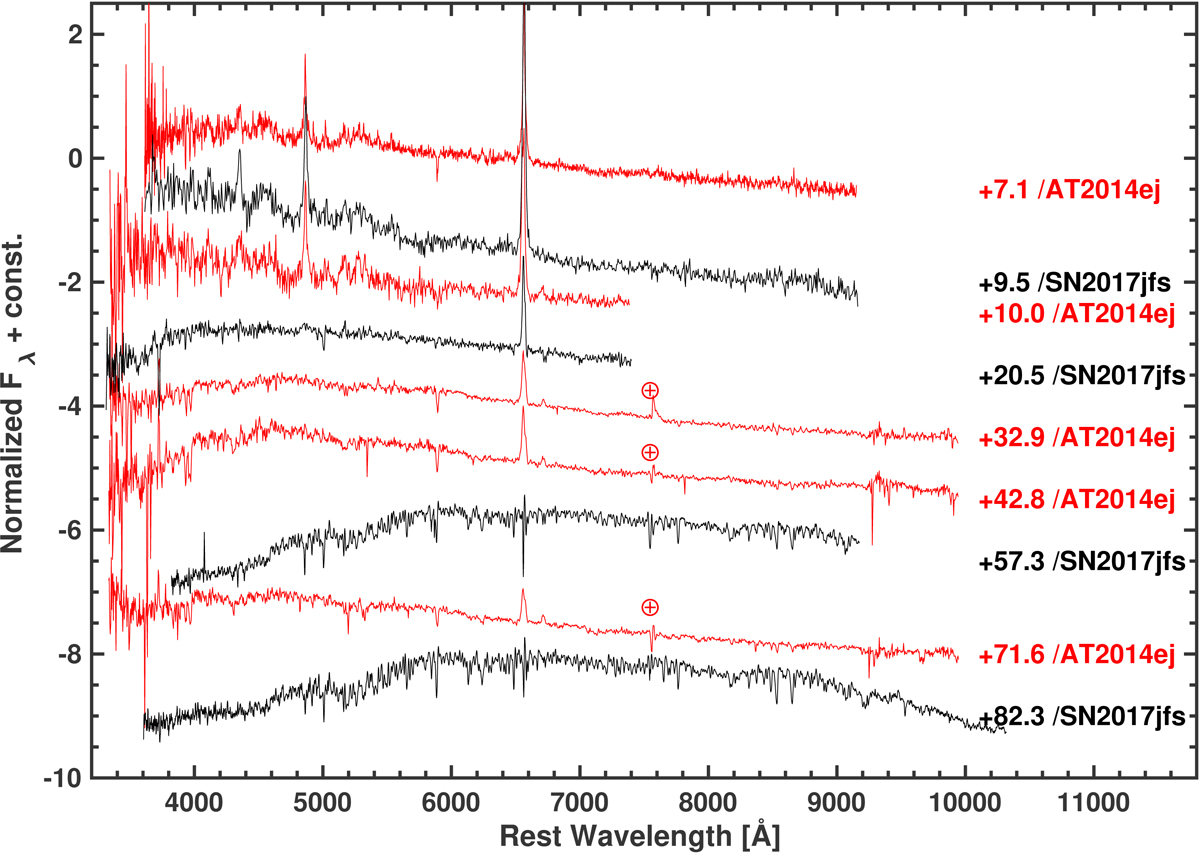
Comparison of visual wavelength spectra of AT 2014ej with similar-epoch spectra of the LRN AT 2017jfs. Each of the spectra was corrected for reddening and is plotted in the rest-frame. Reported phases are in days relative to the first peak.
Current usage metrics show cumulative count of Article Views (full-text article views including HTML views, PDF and ePub downloads, according to the available data) and Abstracts Views on Vision4Press platform.
Data correspond to usage on the plateform after 2015. The current usage metrics is available 48-96 hours after online publication and is updated daily on week days.
Initial download of the metrics may take a while.