Fig. 8.
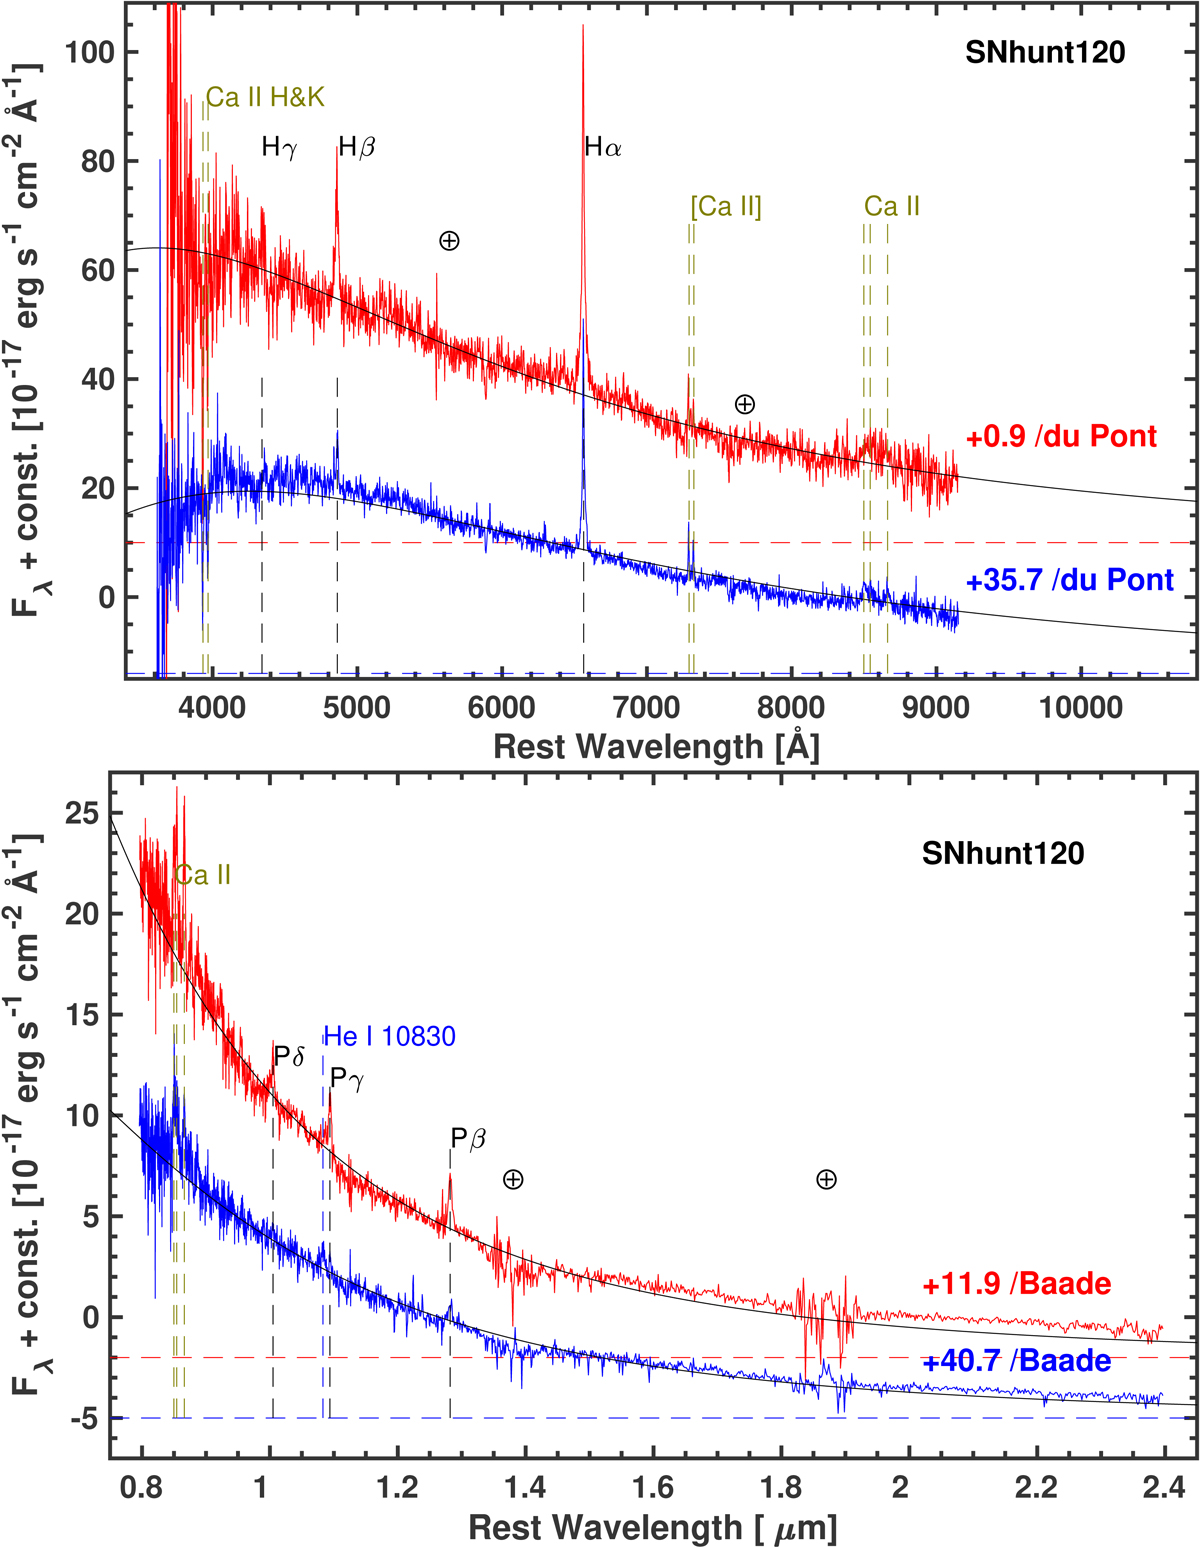
Low-resolution visual (top panel) and NIR wavelength (bottom panel) spectra of SNhunt120 in the rest frame. The flux calibration of each spectrum is adjusted to match the corresponding broadband photometry, and the spectra are corrected for both MW and host-galaxy extinction. The spectra are separated for presentation by the addition of an arbitrary constant. Best-fit BB functions are overplotted as black lines, and the phase of each spectrum relative to the discovery epoch and telescope used to obtain the data is indicated.
Current usage metrics show cumulative count of Article Views (full-text article views including HTML views, PDF and ePub downloads, according to the available data) and Abstracts Views on Vision4Press platform.
Data correspond to usage on the plateform after 2015. The current usage metrics is available 48-96 hours after online publication and is updated daily on week days.
Initial download of the metrics may take a while.