Fig. 6.
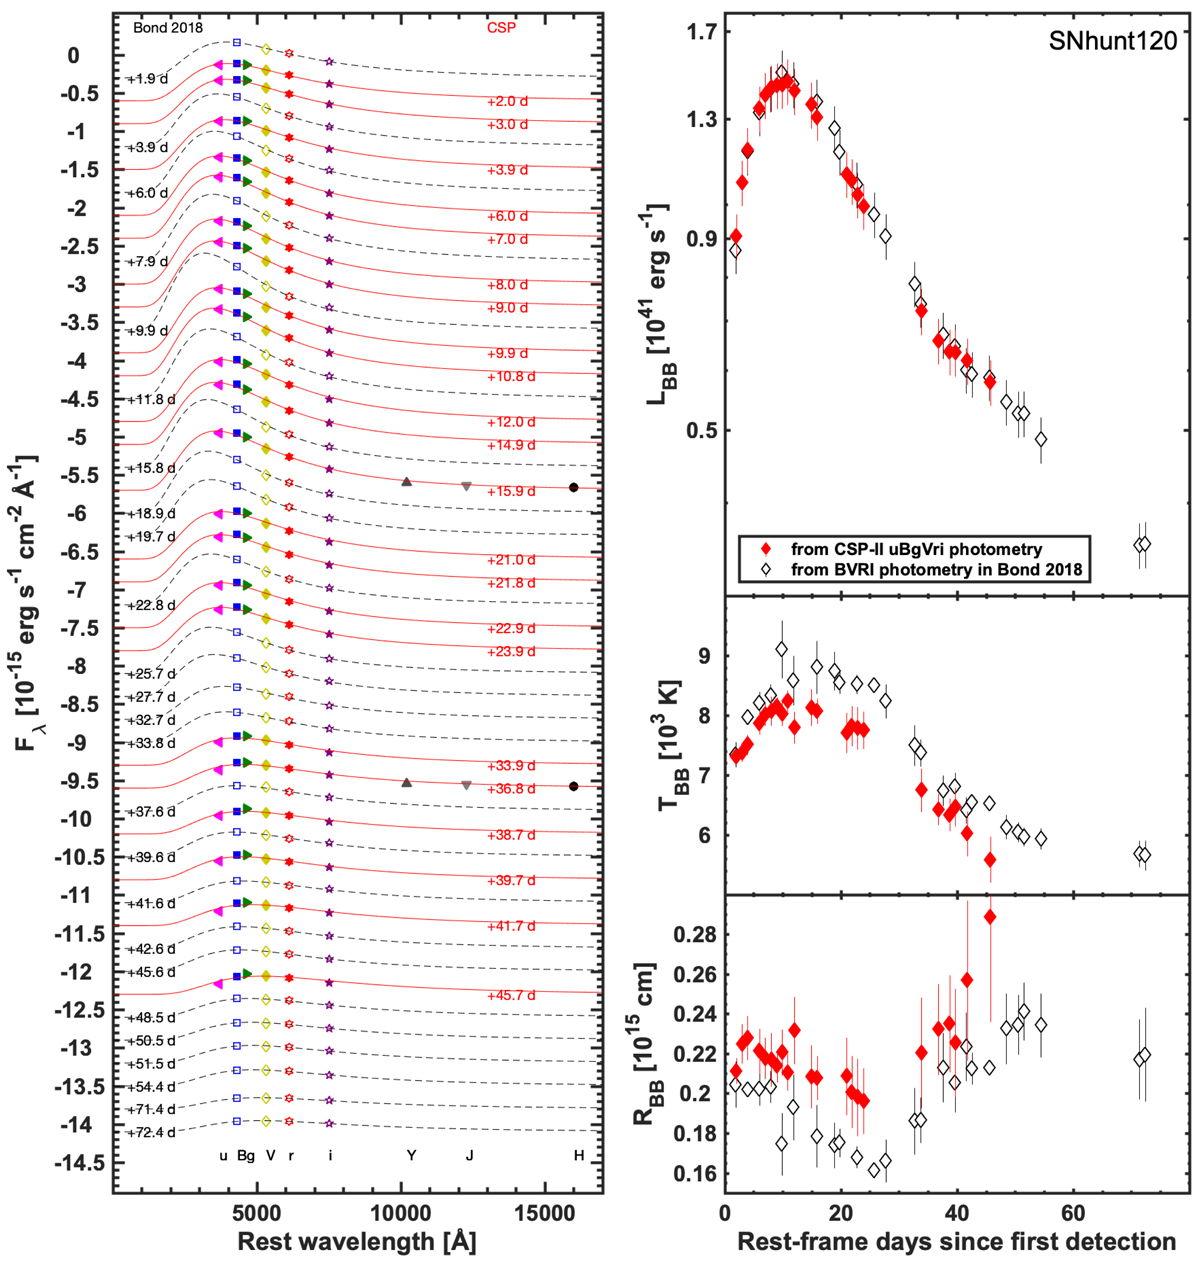
Left: spectral energy distributions of SNhunt120 constructed from our optical photometry and complemented with photometry from Bond (2018). The best-fit BB is overplotted on each SED function; red lines are the fit to CSP-II data, and black lines are the fit to Bond data. For clarity, the SEDs are shifted by arbitrary constants, and the phase of each SED relative to the epoch of discovery is indicated. Right: resulting time evolution of the BB luminosity (top), BB temperature (middle), and BB radius (bottom) of the underlying emission region corresponding to the BB fits.
Current usage metrics show cumulative count of Article Views (full-text article views including HTML views, PDF and ePub downloads, according to the available data) and Abstracts Views on Vision4Press platform.
Data correspond to usage on the plateform after 2015. The current usage metrics is available 48-96 hours after online publication and is updated daily on week days.
Initial download of the metrics may take a while.