Fig. 4.
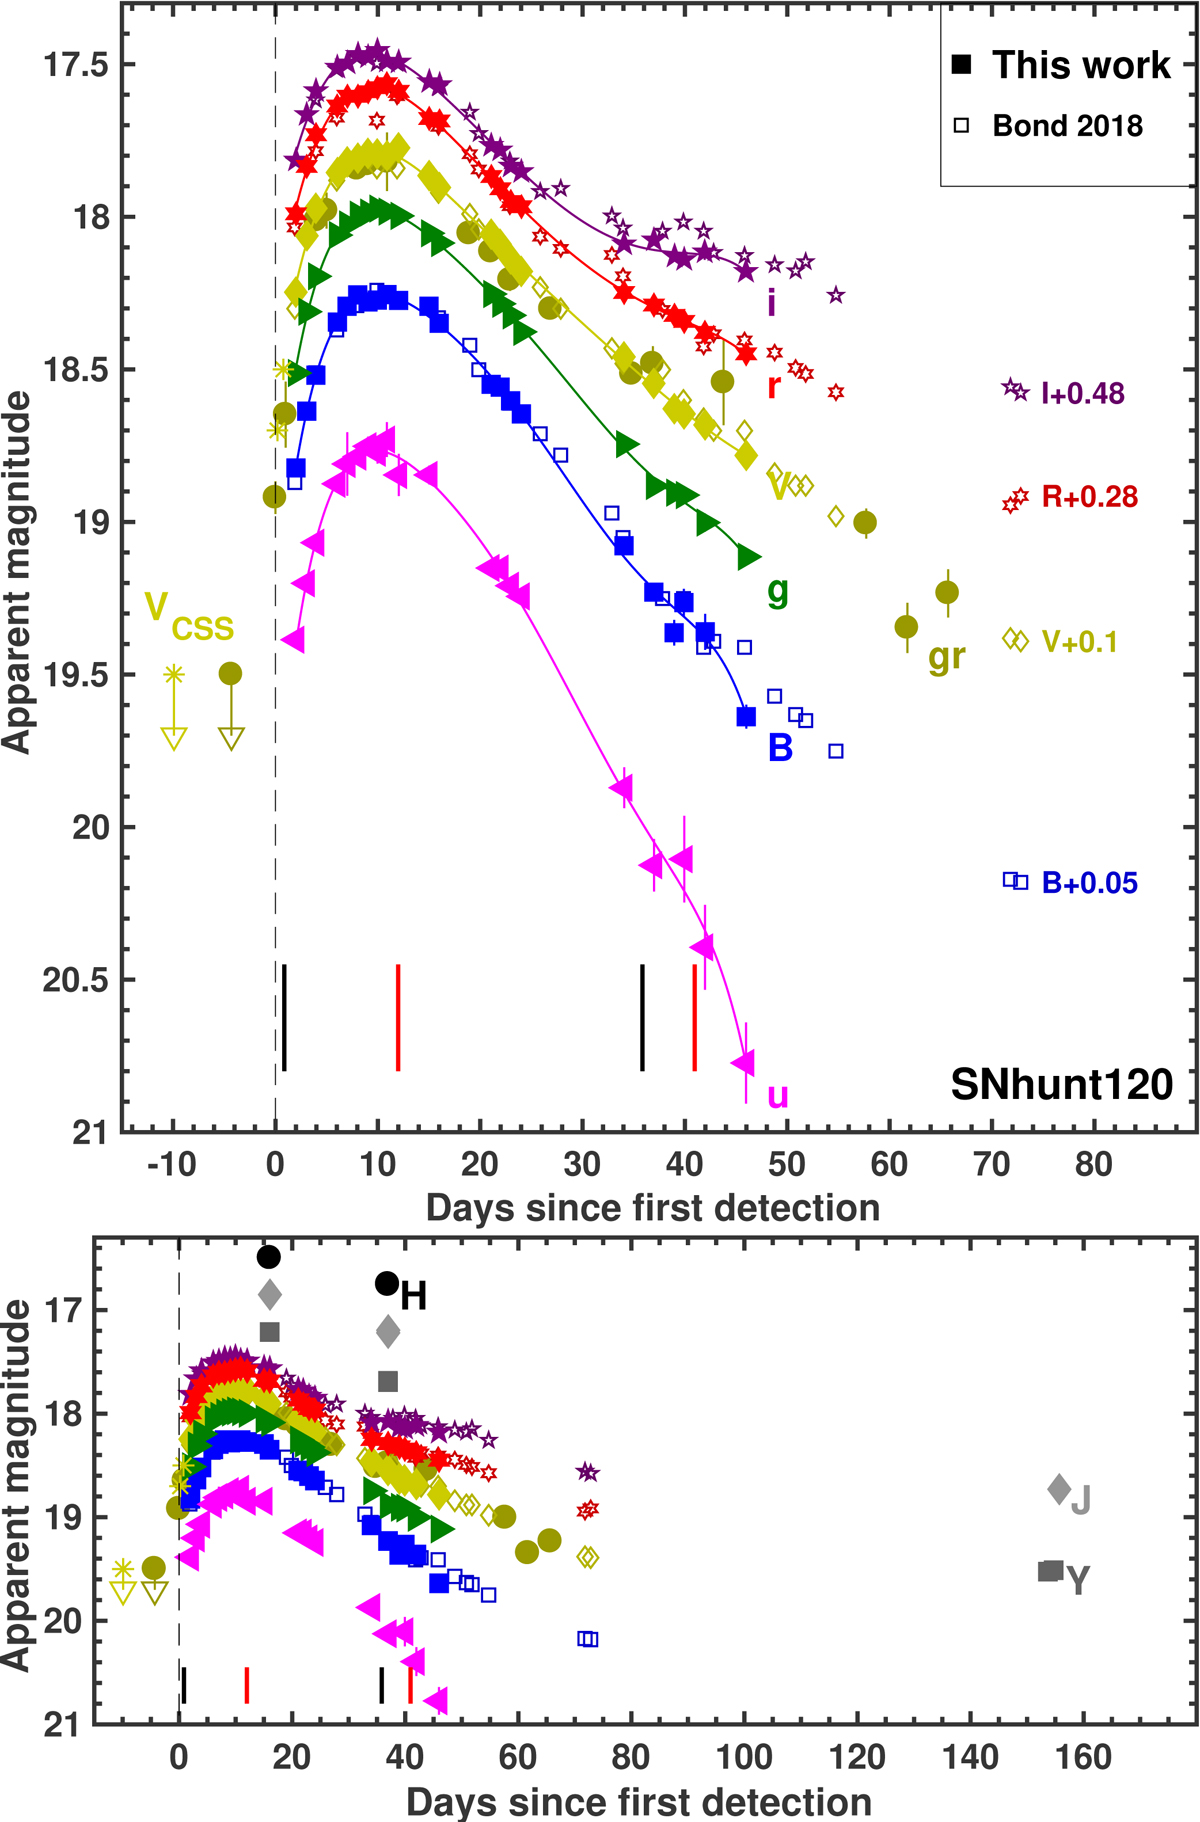
Top: optical uBgVri-band photometry of SNhunt120 obtained by the CSP-II and gr-band photometry from LSQ. The light curves cover the rise to maximum and subsequent decline over the period of a month and a half. The Catalina Sky Survey (CSS; Howerton et al. 2012) reported V-band discovery magnitude of 18.7 obtained on March 27.49, a CSS V-band nondetection limit of 19.5 mag obtained from data taken on March 17.39 UT, and an unfiltered photometry point obtained on March 28.07 of 18.5 mag are also plotted. The BVRI photometry published by Bond (2018) is overplotted with open symbols; each band is shifted by arbitrary constants to match their most similar CSP-II band. The CSP-II light curves are fit with low-order polynomials plotted as solid colored lines. Optical spectral phases are marked by black segments, and NIR spectral phases are marked by red segments. Bottom: as in the top panel, but also including the NIR (YJH) points of SNhunt120.
Current usage metrics show cumulative count of Article Views (full-text article views including HTML views, PDF and ePub downloads, according to the available data) and Abstracts Views on Vision4Press platform.
Data correspond to usage on the plateform after 2015. The current usage metrics is available 48-96 hours after online publication and is updated daily on week days.
Initial download of the metrics may take a while.