Fig. 3.
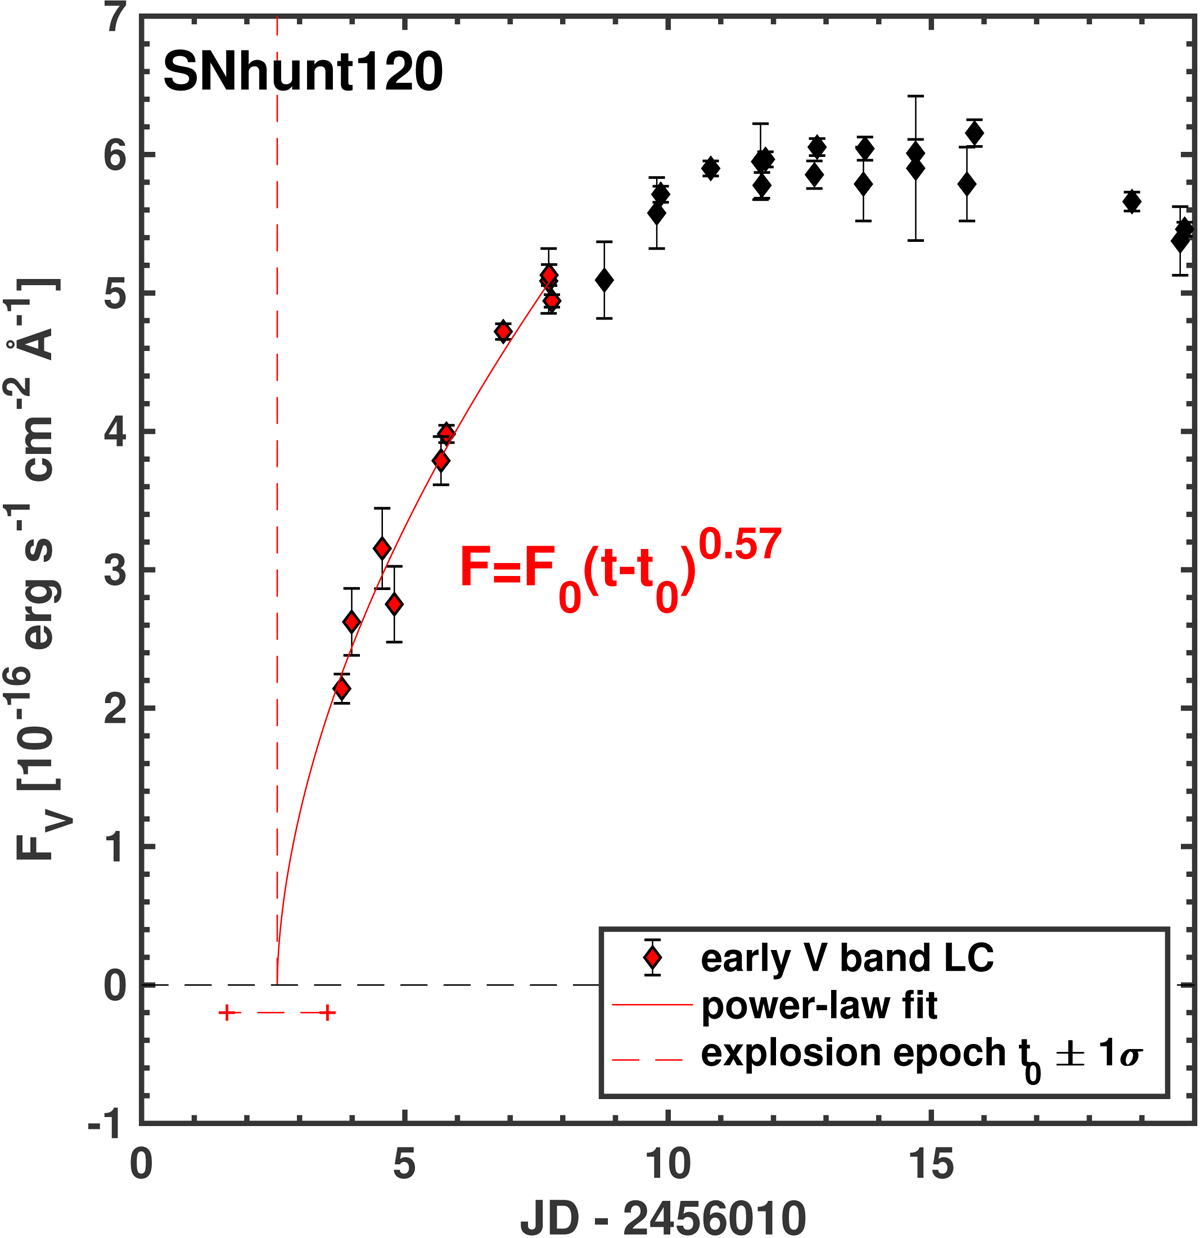
Early light curve of SNhunt120 plotted with a best-fit power-law function (solid line, reduced χ2 = 4.6) to the first ten epochs (red points) of photometry. The explosion epoch, t0, is estimated to have occurred on JD+2456012.58±0.95, which is 1.25 days prior to the first-detection epoch. The dashed red line marks t0 as obtained from the fit, its uncertainty is marked by a red segment just below the zero-flux level.
Current usage metrics show cumulative count of Article Views (full-text article views including HTML views, PDF and ePub downloads, according to the available data) and Abstracts Views on Vision4Press platform.
Data correspond to usage on the plateform after 2015. The current usage metrics is available 48-96 hours after online publication and is updated daily on week days.
Initial download of the metrics may take a while.