Fig. 13.
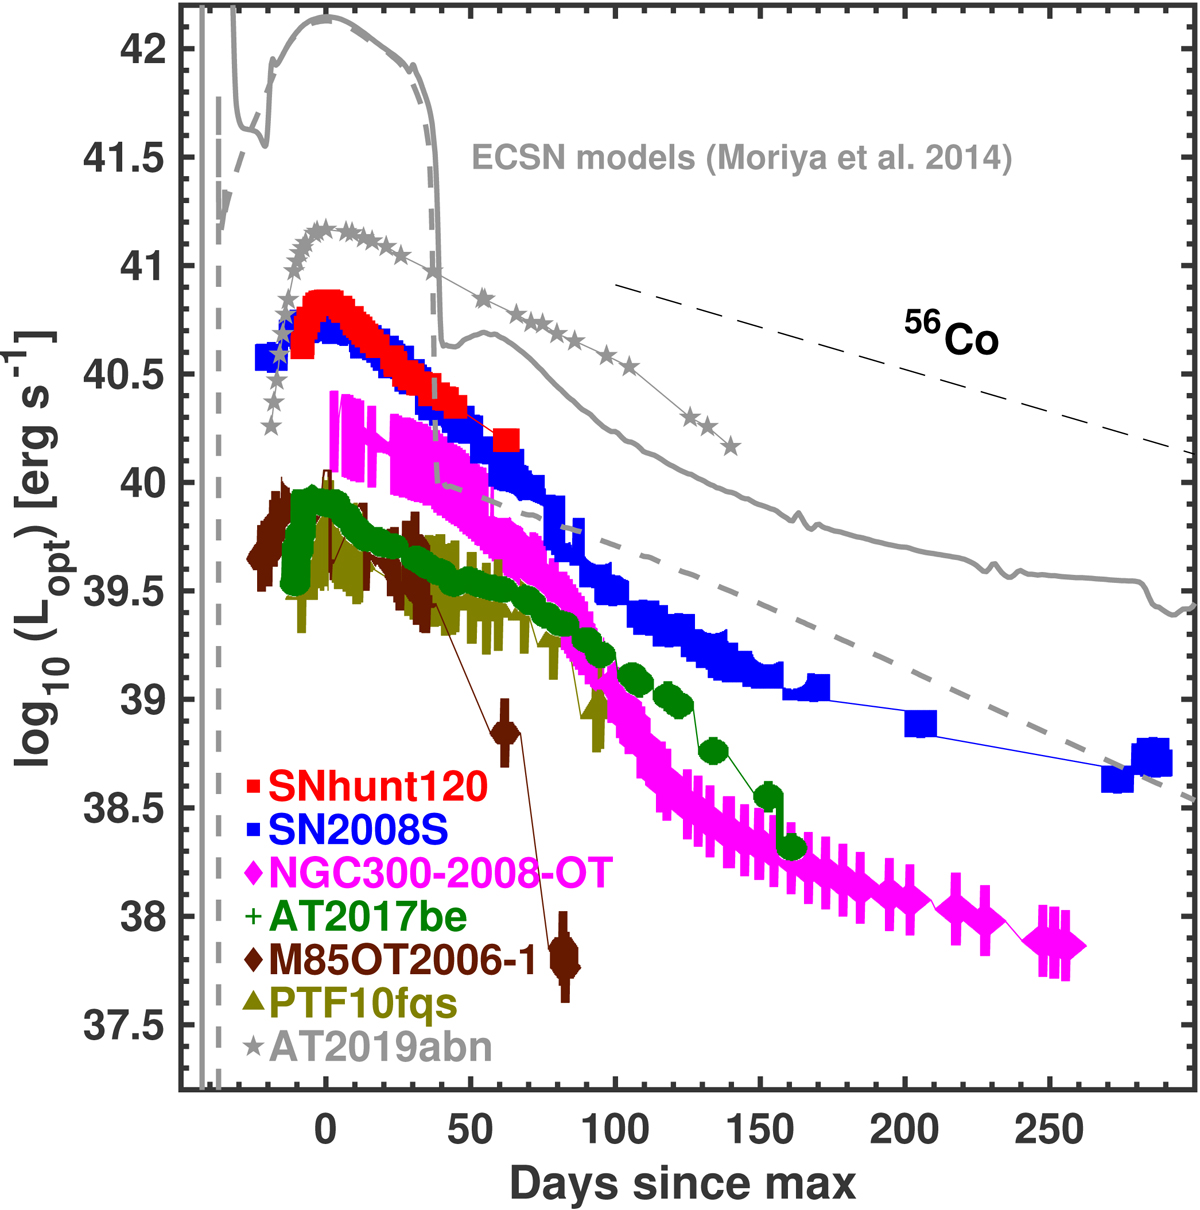
Pseudo-bolometric light curve of SNhunt120 compared to the light curves of our EC SN comparison sample from Cai et al. (2018) and AT 2019abn (Jencson et al. 2019; Williams et al. 2020). The light curves of two EC SN models from Moriya et al. (2014) without CSI (dashed line) and a model with (solid line) CSI are also plotted. The dashed straight line corresponds to the complete trapping of the 56Co → 56Fe energy deposition.
Current usage metrics show cumulative count of Article Views (full-text article views including HTML views, PDF and ePub downloads, according to the available data) and Abstracts Views on Vision4Press platform.
Data correspond to usage on the plateform after 2015. The current usage metrics is available 48-96 hours after online publication and is updated daily on week days.
Initial download of the metrics may take a while.