Fig. 1.
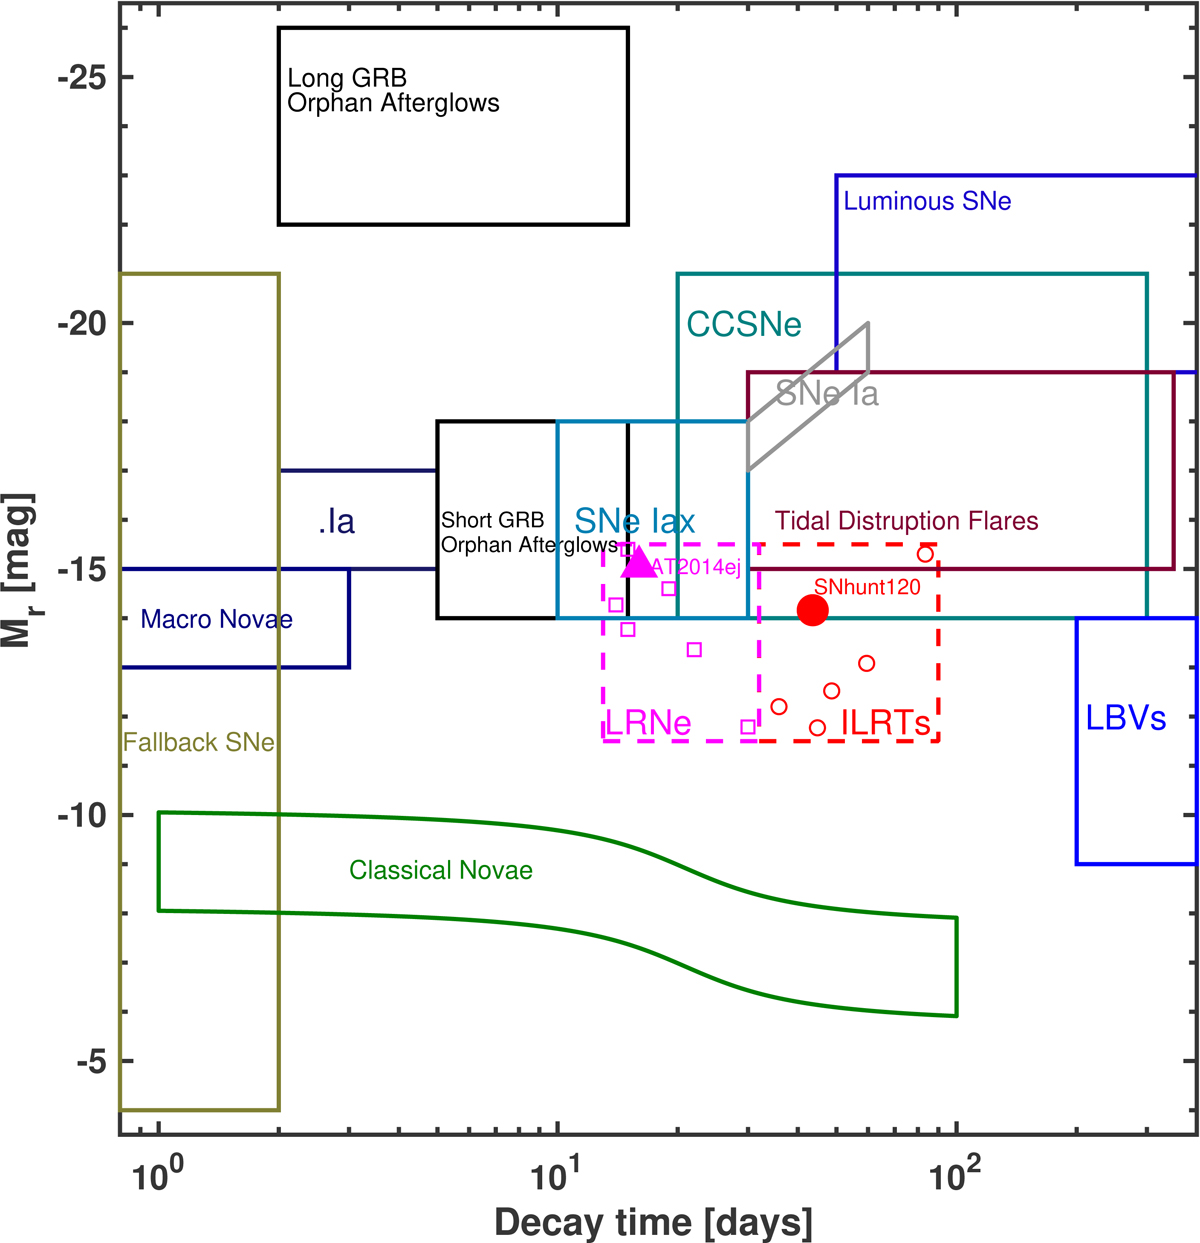
Absolute peak r-band magnitude vs. decay time (defined as the time taken for the r-band light curve to decline one magnitude from peak) for optical transients. The figure is adapted from Kasliwal (2011) and Rau et al. (2009). Peak absolute r-band magnitudes and decay times for the ILRTs and LRNe are plotted as red circles and magenta squares, respectively. The LRN AT 2014ej plotted as a magenta triangle is a lower limit (see Paper II). The LRNe and ILRTs regions are plotted as dashed lines to highlight the point that the full extent of the parameter space occupied by each subtype is unknown.
Current usage metrics show cumulative count of Article Views (full-text article views including HTML views, PDF and ePub downloads, according to the available data) and Abstracts Views on Vision4Press platform.
Data correspond to usage on the plateform after 2015. The current usage metrics is available 48-96 hours after online publication and is updated daily on week days.
Initial download of the metrics may take a while.