Fig. 8.
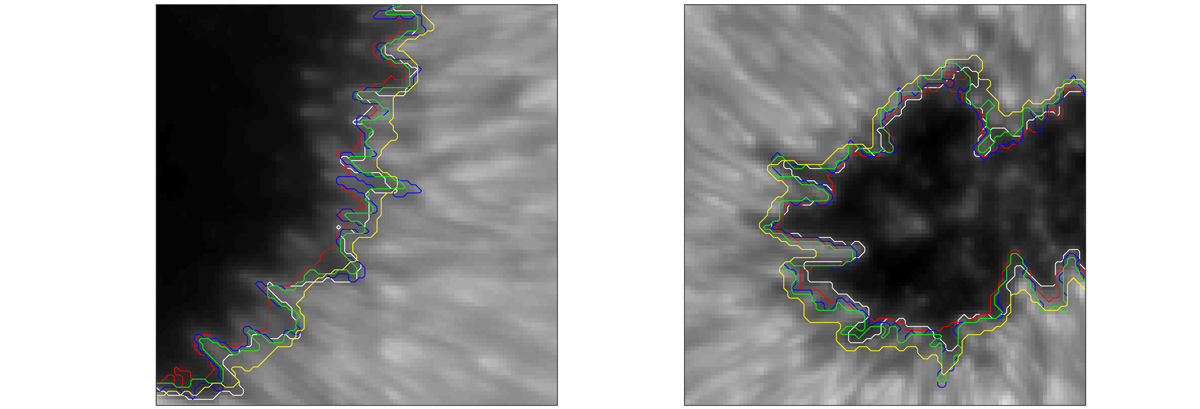
Maps of the continuum intensity for AR 10923 observed on 14 November 2006 (left) and for AR 10969 observed on 27 August 2007 (right). The white contours indicate a continuum intensity of 50% of the quiet Sun level. The other contours correspond to Bcrit(log τ) inferred for the different nodes in the inversion (see Table 2). Blue: log τ = 0, green: log τ = −0.9, and yellow: log τ = −2.5. The red contour represents an inversion, where the magnetic field is independent of height, and shows a value of 1867 G. The field-of-view of the two panels is indicated by the white boxes in Fig. 1. The size of the field-of-view is the same in both panels.
Current usage metrics show cumulative count of Article Views (full-text article views including HTML views, PDF and ePub downloads, according to the available data) and Abstracts Views on Vision4Press platform.
Data correspond to usage on the plateform after 2015. The current usage metrics is available 48-96 hours after online publication and is updated daily on week days.
Initial download of the metrics may take a while.