Fig. 7.
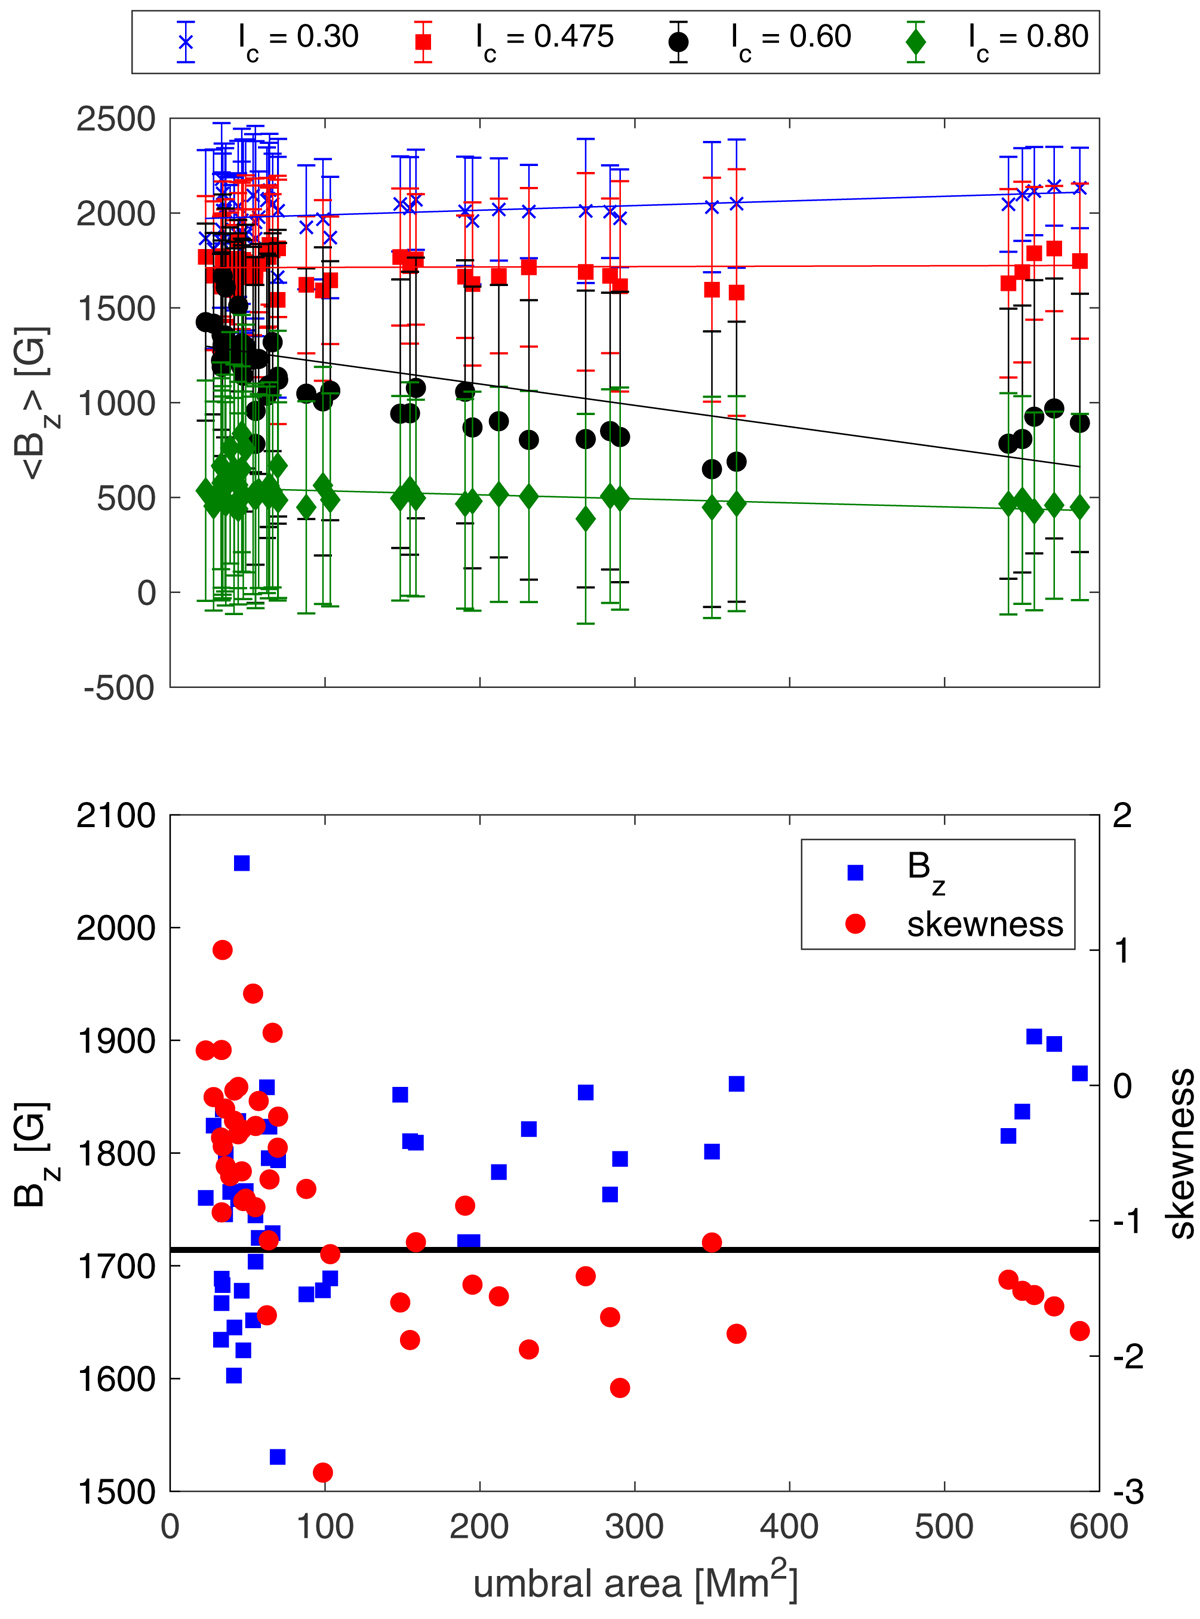
Dependence of the vertical magnetic field on intensity and umbral area. Top panel: vertical magnetic field averaged at fixed values of the continuum intensity plotted as a function of the area of the umbra for the individual spots. We consider four different values of the continuum intensity, 0.30 (blue), 0.475 (red), 0.60 (black), and 0.80 (green). The error bars correspond to the standard deviation of the magnetic field within the individual spots. The solid lines are linear fits for the different values of the continuum intensity. Bottom panel: estimate of the strength of Bz of the spines at IC = 0.475 (blue squares, see text for more details) and the skewness of the histograms of Bz (red circles) at this intensity as a function of the umbral area. The horizontal line indicates the mean Bz at IC = 0.475 averaged over all spots in our sample.
Current usage metrics show cumulative count of Article Views (full-text article views including HTML views, PDF and ePub downloads, according to the available data) and Abstracts Views on Vision4Press platform.
Data correspond to usage on the plateform after 2015. The current usage metrics is available 48-96 hours after online publication and is updated daily on week days.
Initial download of the metrics may take a while.