Fig. 6.
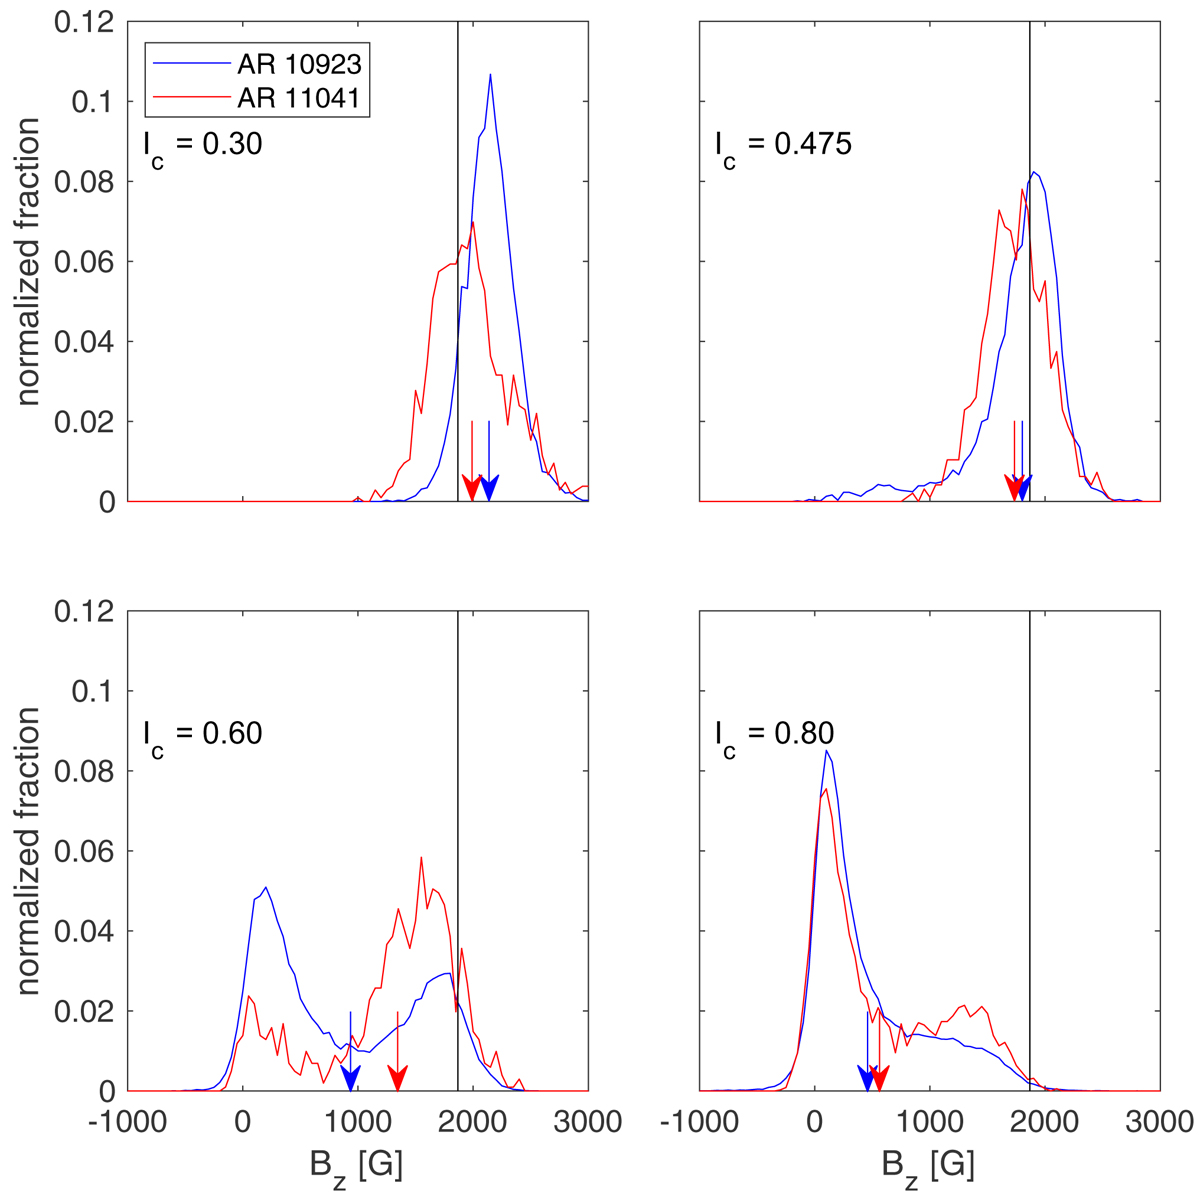
Vertical cuts across the 2D histograms shown in Fig. 4 at different values of the continuum intensity (indicated by the vertical white lines in Fig. 4). From top left to bottom right:IC = 0.30, 0.475, 0.60, and 0.80. In all panels, the blue curve corresponds to AR 10923 and the red one to AR 11041. We normalized each histogram to unity. The arrows indicate the mean value of the vertical magnetic field for the different distributions. The black vertical line shows 1867 G for comparison.
Current usage metrics show cumulative count of Article Views (full-text article views including HTML views, PDF and ePub downloads, according to the available data) and Abstracts Views on Vision4Press platform.
Data correspond to usage on the plateform after 2015. The current usage metrics is available 48-96 hours after online publication and is updated daily on week days.
Initial download of the metrics may take a while.