Fig. 5.
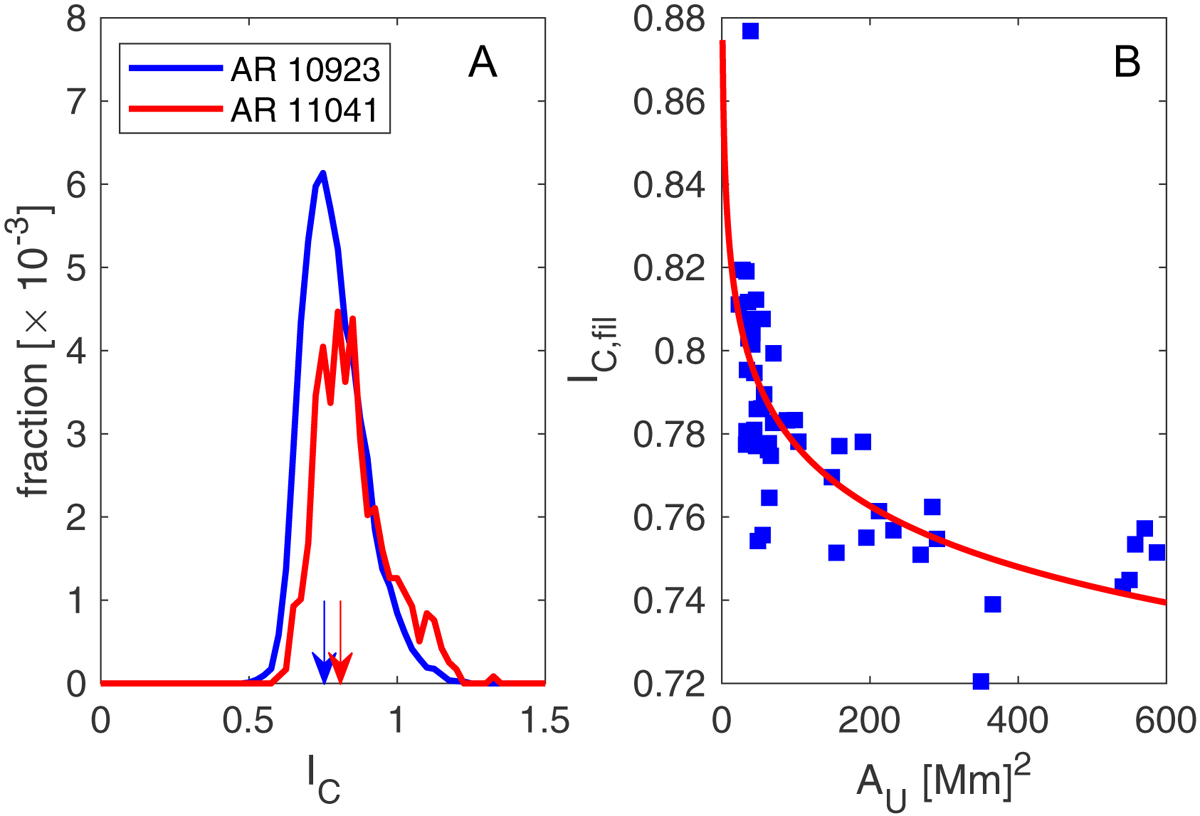
Panel A: histograms of the continuum intensity for a fixed Bz = 150 G for AR 10923 (blue) and AR 11041 (red). These are horizontal cuts across the two histograms shown in Fig. 4 along the dashed horizontal lines. The arrows show the intensity IC, fil corresponding to the maximum of the region of the histograms that affected by the filaments (as indicated by the red circles in Fig. 4. Panel B:IC, fil for all the spots in our sample as a function of the total size of the umbra. The red line shows a fit to the data (IC, fil = 0.91−0.02log AU).
Current usage metrics show cumulative count of Article Views (full-text article views including HTML views, PDF and ePub downloads, according to the available data) and Abstracts Views on Vision4Press platform.
Data correspond to usage on the plateform after 2015. The current usage metrics is available 48-96 hours after online publication and is updated daily on week days.
Initial download of the metrics may take a while.