Fig. 4.
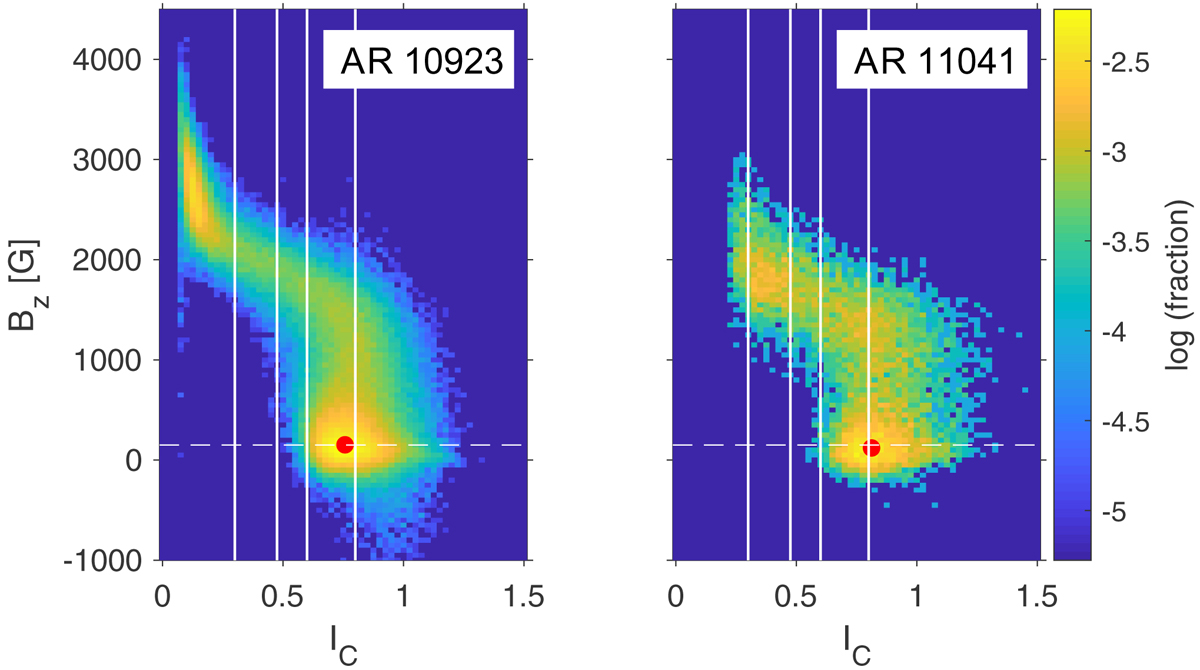
2D histograms of the vertical magnetic field (at log τ = −0.9) and of the continuum intensity in two sunspots, the large spot AR 10923 observed on 14 November 2006 (left) and the small spot AR 11041 observed on 26 January 2010 (right). The histograms are plotted on a logarithmic scale. The dashed horizontal line at 150 G (i.e., the penumbral filaments) indicates the position of a horizontal cut across the histograms, which are shown in the left panel of Fig. 5. The vertical lines (at IC = 0.30, 0.475, 0.60, and 0.80) mark the position of vertical cuts (shown in Fig. 6). The red circles show the position of the maximum of the part of the histogram that is affected by the filaments. See text for more details.
Current usage metrics show cumulative count of Article Views (full-text article views including HTML views, PDF and ePub downloads, according to the available data) and Abstracts Views on Vision4Press platform.
Data correspond to usage on the plateform after 2015. The current usage metrics is available 48-96 hours after online publication and is updated daily on week days.
Initial download of the metrics may take a while.