Fig. 3.
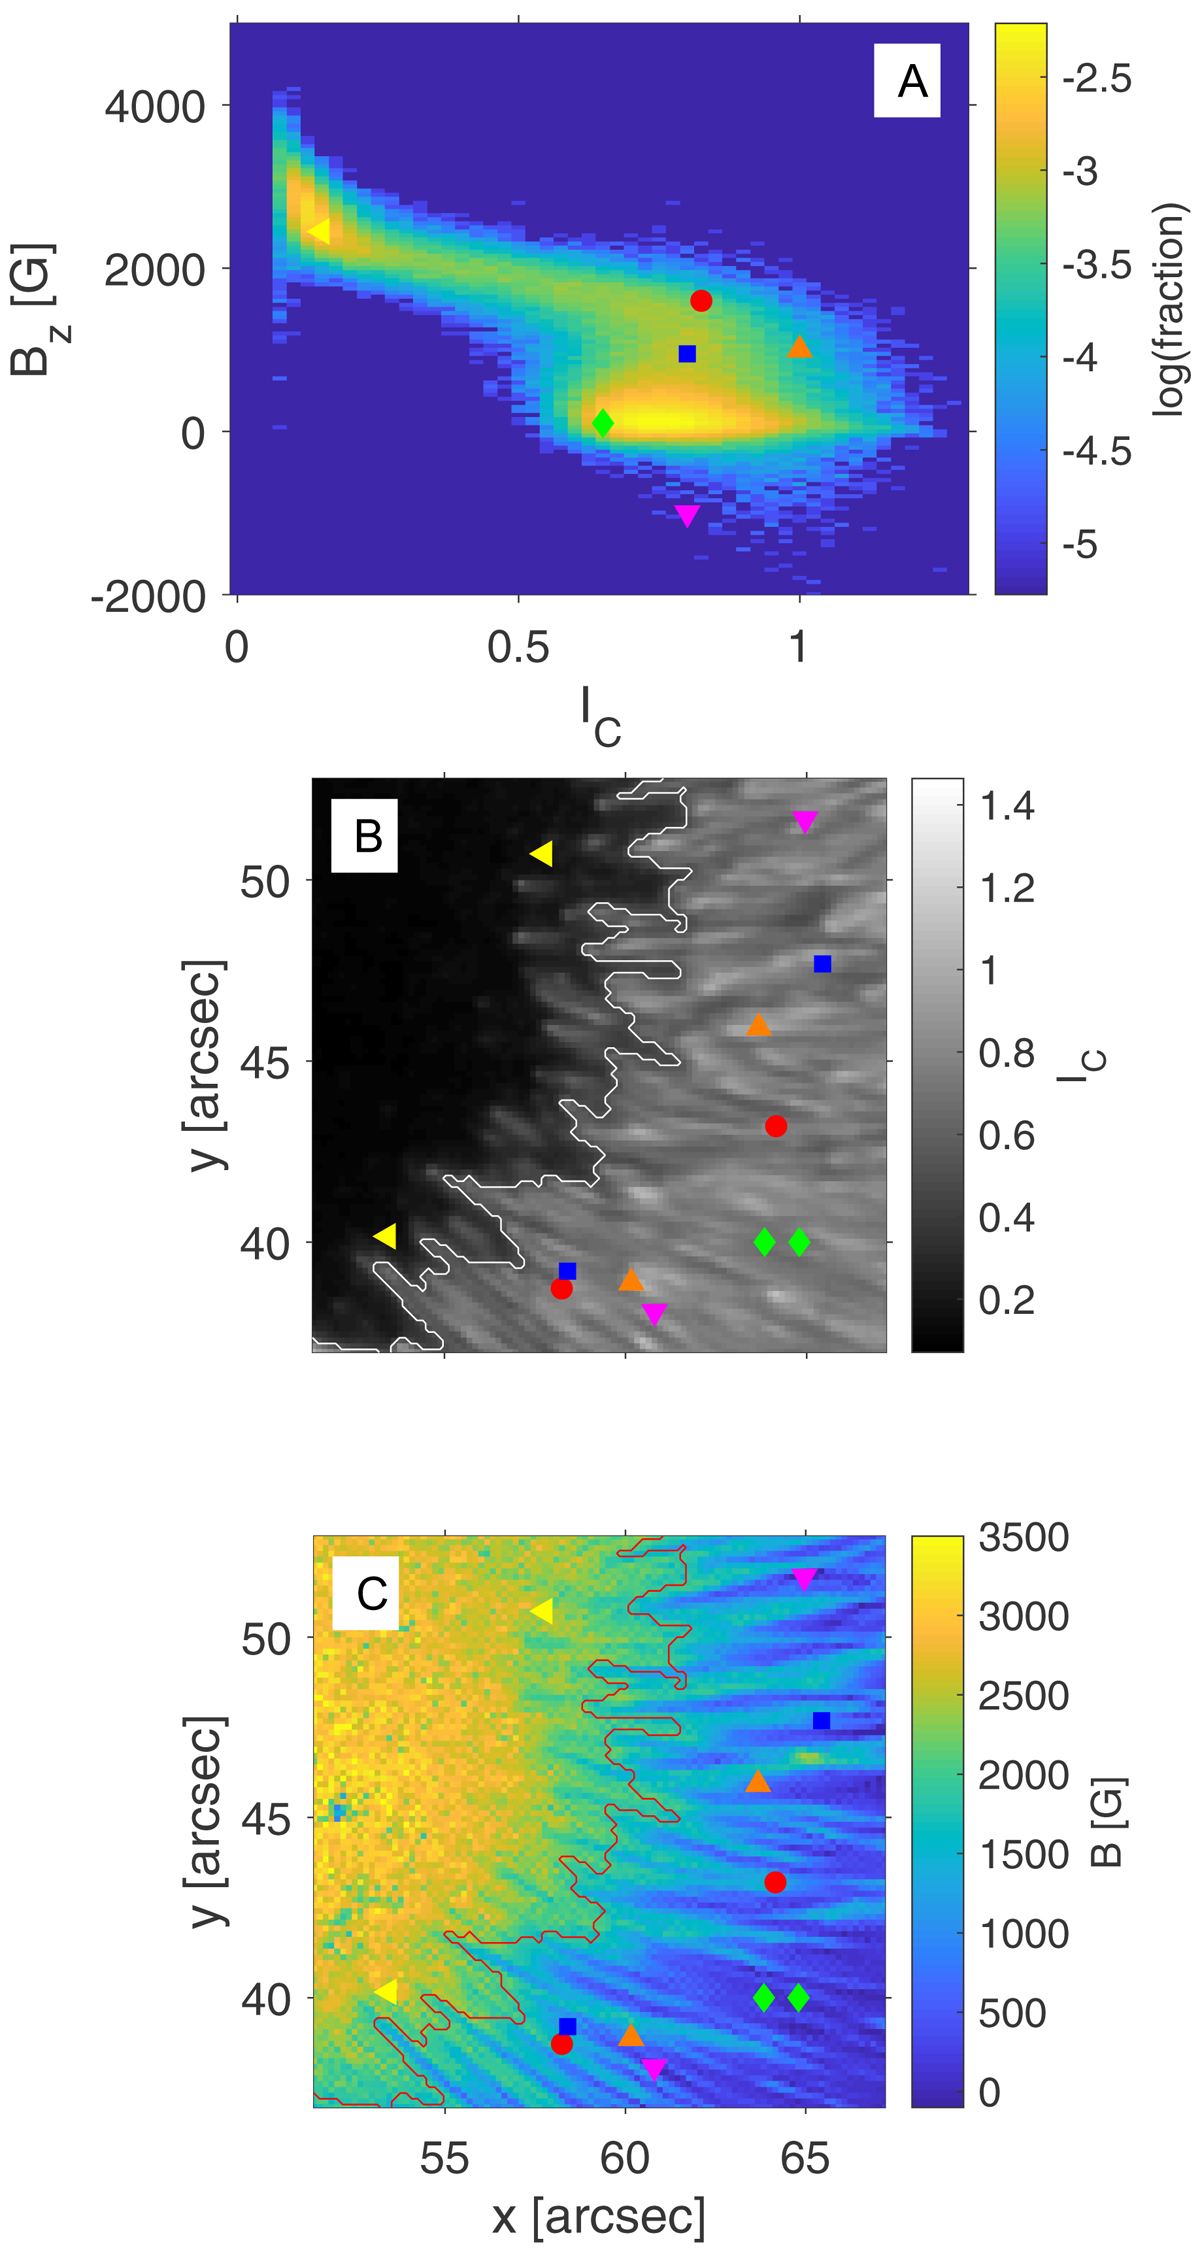
Panel A: 2D histogram of the vertical magnetic field (at log τ − 0.9) and the continuum intensity of AR 10923 observed on 14 November 2006 plotted on a logarithmic scale. Also shown are maps of the continuum intensity (panel B) and of Bz at log τ = −0.9 (panel C) of the spot. The field-of-view of these maps is the same as in Fig. 2. The contours in panels B and C indicate a continuum intensity of 50% of the quiet Sun level. In order to understand the shape of the histogram, we selected specific regions in the histogram and show examples of the corresponding features in the bottom two panels. Yellow triangles: outer parts of the umbra, red circles: spines, blue squares: transition from spines to filaments, green diamonds: dark central part of filaments, orange triangles: bright heads of filaments, and purple triangles: filaments tails exhibiting opposite polarity field. We reversed the sign of Bz to be positive in the umbra
Current usage metrics show cumulative count of Article Views (full-text article views including HTML views, PDF and ePub downloads, according to the available data) and Abstracts Views on Vision4Press platform.
Data correspond to usage on the plateform after 2015. The current usage metrics is available 48-96 hours after online publication and is updated daily on week days.
Initial download of the metrics may take a while.