Fig. 1.
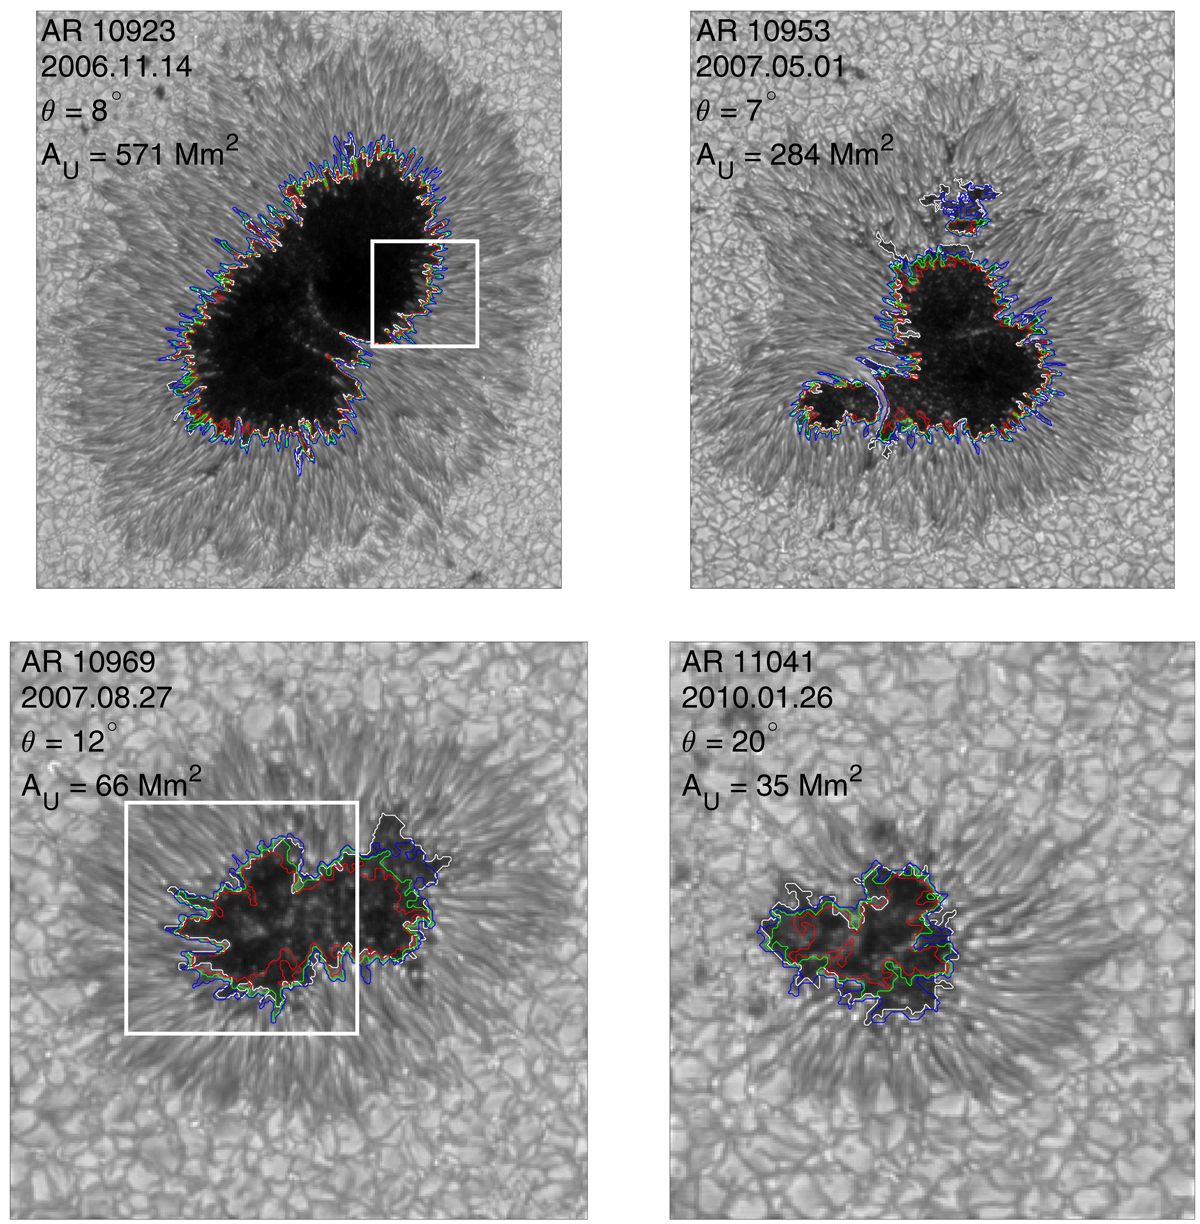
Maps of the continuum intensity of selected sunspots. The white contours indicate a continuum intensity of 50% of the quiet Sun level. The other contours correspond to different strengths of the vertical magnetic field, evaluated at log τ = −0.9. Blue: 1650 G, green: 1750 G, and red: 1867 G. The white rectangles highlight regions of AR 10923 and AR 19069 that are shown in more detail later in the paper.
Current usage metrics show cumulative count of Article Views (full-text article views including HTML views, PDF and ePub downloads, according to the available data) and Abstracts Views on Vision4Press platform.
Data correspond to usage on the plateform after 2015. The current usage metrics is available 48-96 hours after online publication and is updated daily on week days.
Initial download of the metrics may take a while.