Fig. 2
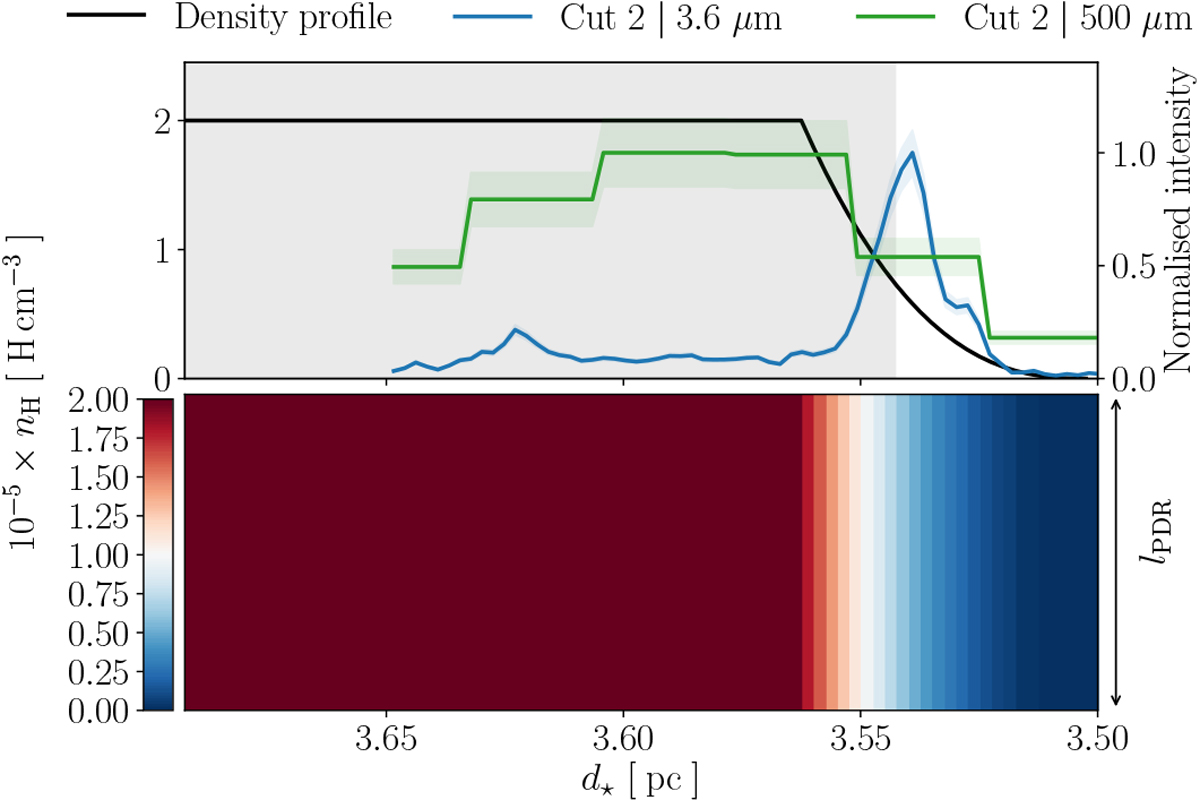
Top: assumed density profile across the Horsehead (black line, see Sect. 2.3). Normalised dust-observed emission (blue line) in IRAC3.6 (see Fig. 1). Normalised dust observed emission (green line) in SPIRE500. The grey part corresponds to the inner part of the Horsehead, defined in Sect. 4.4. Bottom: density profile in 2D-space defined by the distance to the star, d⋆, and the length of the Horsehead along the line of sight, lPDR.
Current usage metrics show cumulative count of Article Views (full-text article views including HTML views, PDF and ePub downloads, according to the available data) and Abstracts Views on Vision4Press platform.
Data correspond to usage on the plateform after 2015. The current usage metrics is available 48-96 hours after online publication and is updated daily on week days.
Initial download of the metrics may take a while.