Fig. 6.
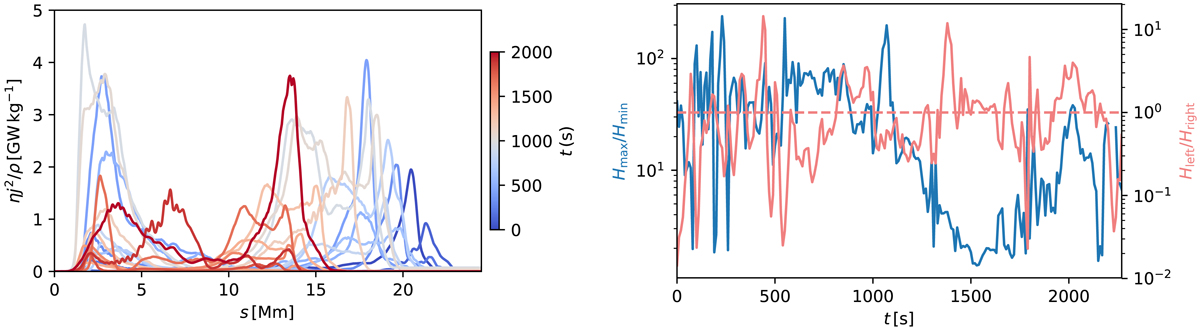
Left: Joule heating per unit mass along the length of the coronal loop L1 plotted every 100 s. The x axis corresponds to the position along the loop measured from left to right footpoint. The profiles have been smoothed with a boxcar average with kernel length of 0.5 Mm for clarity. Right: evolution of the heating asymmetry quantified as the ratio of the maximum heating in the loop legs to minimum heating at the loop apex Hmax/Hmin (blue) and left-to-right asymmetry in heating of the loop legs Hleft/Hright (red) for the loop L1. The red dashed line indicates where Hleft/Hright = 1, i.e. the line corresponding to perfectly symmetric heating for reference.
Current usage metrics show cumulative count of Article Views (full-text article views including HTML views, PDF and ePub downloads, according to the available data) and Abstracts Views on Vision4Press platform.
Data correspond to usage on the plateform after 2015. The current usage metrics is available 48-96 hours after online publication and is updated daily on week days.
Initial download of the metrics may take a while.