Fig. 5.
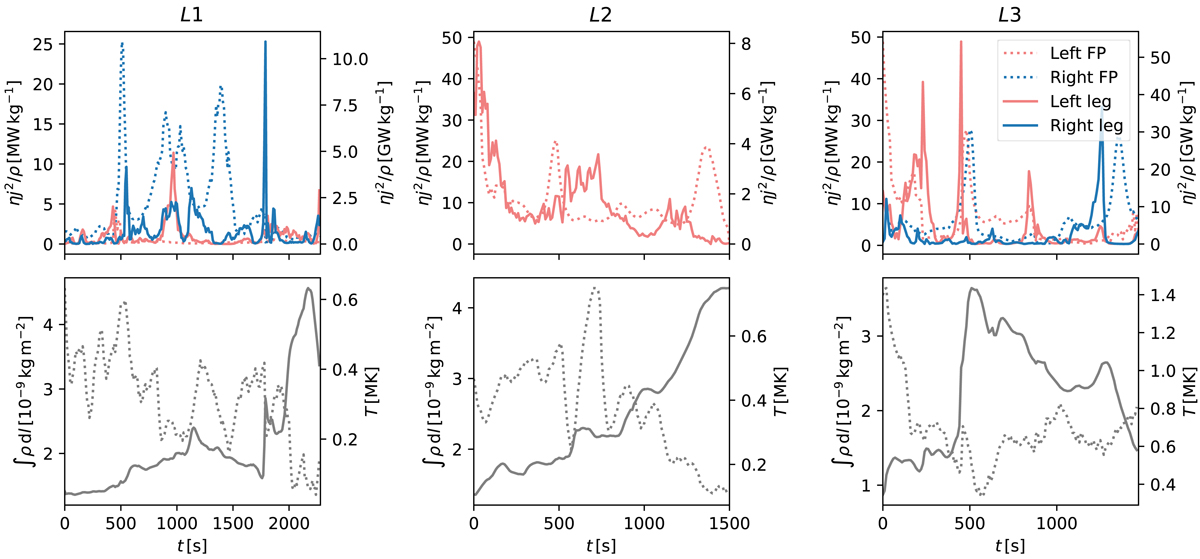
Top: evolution of the Joule heating at the footpoints of the loops below z = 1.2 Mm in the chromosphere (dotted line, left axis) and 3 Mm above the transition region in the corona (solid line, right axis) for loops L1, L2, and L3. Red and blue plots correspond to the heating evolution at the left and right loop footpoint respectively. Bottom: evolution of density of the plasma integrated along the coronal portion of the loop (dotted line), and average temperature in the coronal part of the loop (solid line) for L1, L2, and L3.
Current usage metrics show cumulative count of Article Views (full-text article views including HTML views, PDF and ePub downloads, according to the available data) and Abstracts Views on Vision4Press platform.
Data correspond to usage on the plateform after 2015. The current usage metrics is available 48-96 hours after online publication and is updated daily on week days.
Initial download of the metrics may take a while.