Fig. 4.
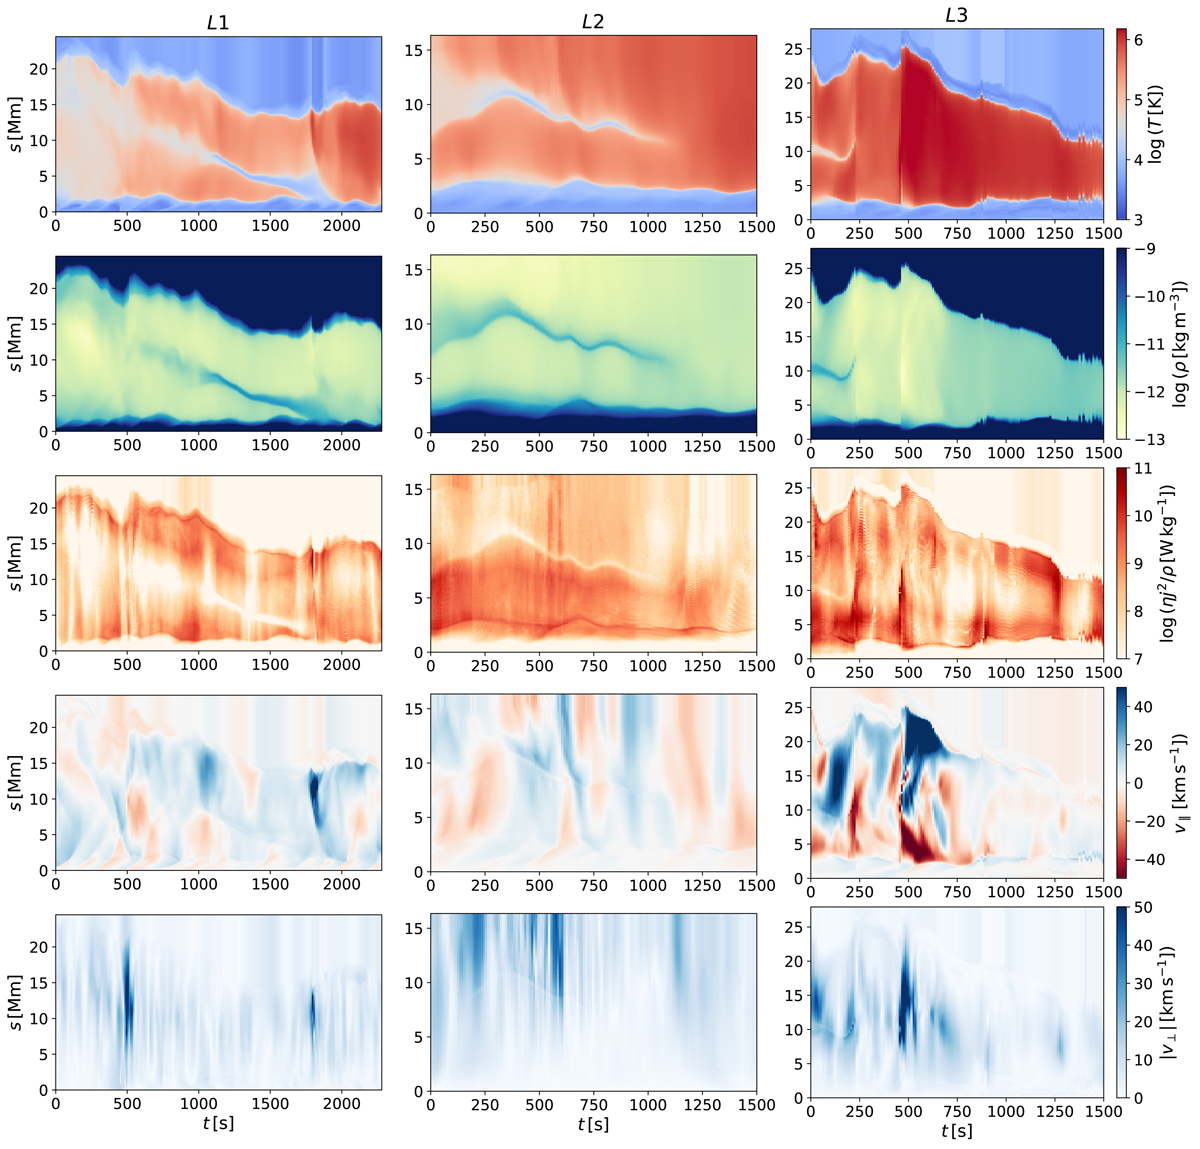
Evolution of temperature, density, Joule heating per unit mass, velocity along the magnetic field, and the magnitude of the velocity in the plane perpendicular to the magnetic field (top to bottom) along thermally unstable loops L1, L2, and L3 (left to right) following the formation, evolution, and potential destruction of the cool plasma condensations. The x axis corresponds to time and the y axis corresponds to the position along the loop measured from left to right footpoint.
Current usage metrics show cumulative count of Article Views (full-text article views including HTML views, PDF and ePub downloads, according to the available data) and Abstracts Views on Vision4Press platform.
Data correspond to usage on the plateform after 2015. The current usage metrics is available 48-96 hours after online publication and is updated daily on week days.
Initial download of the metrics may take a while.